This is a real fintech company that wants to provide its customers with a paid mobile app subscription that will allow them to track all of their finances in one place. To attract customers, the company releases a free version of their app with some main features unlocked.
The purpose of this project is to identify which users will most likely not enroll in the paid product so that additional offers can be given to them. This is just an example of how I find out the company's potential customers. The techniques I used here could be
applied in other companies as well.
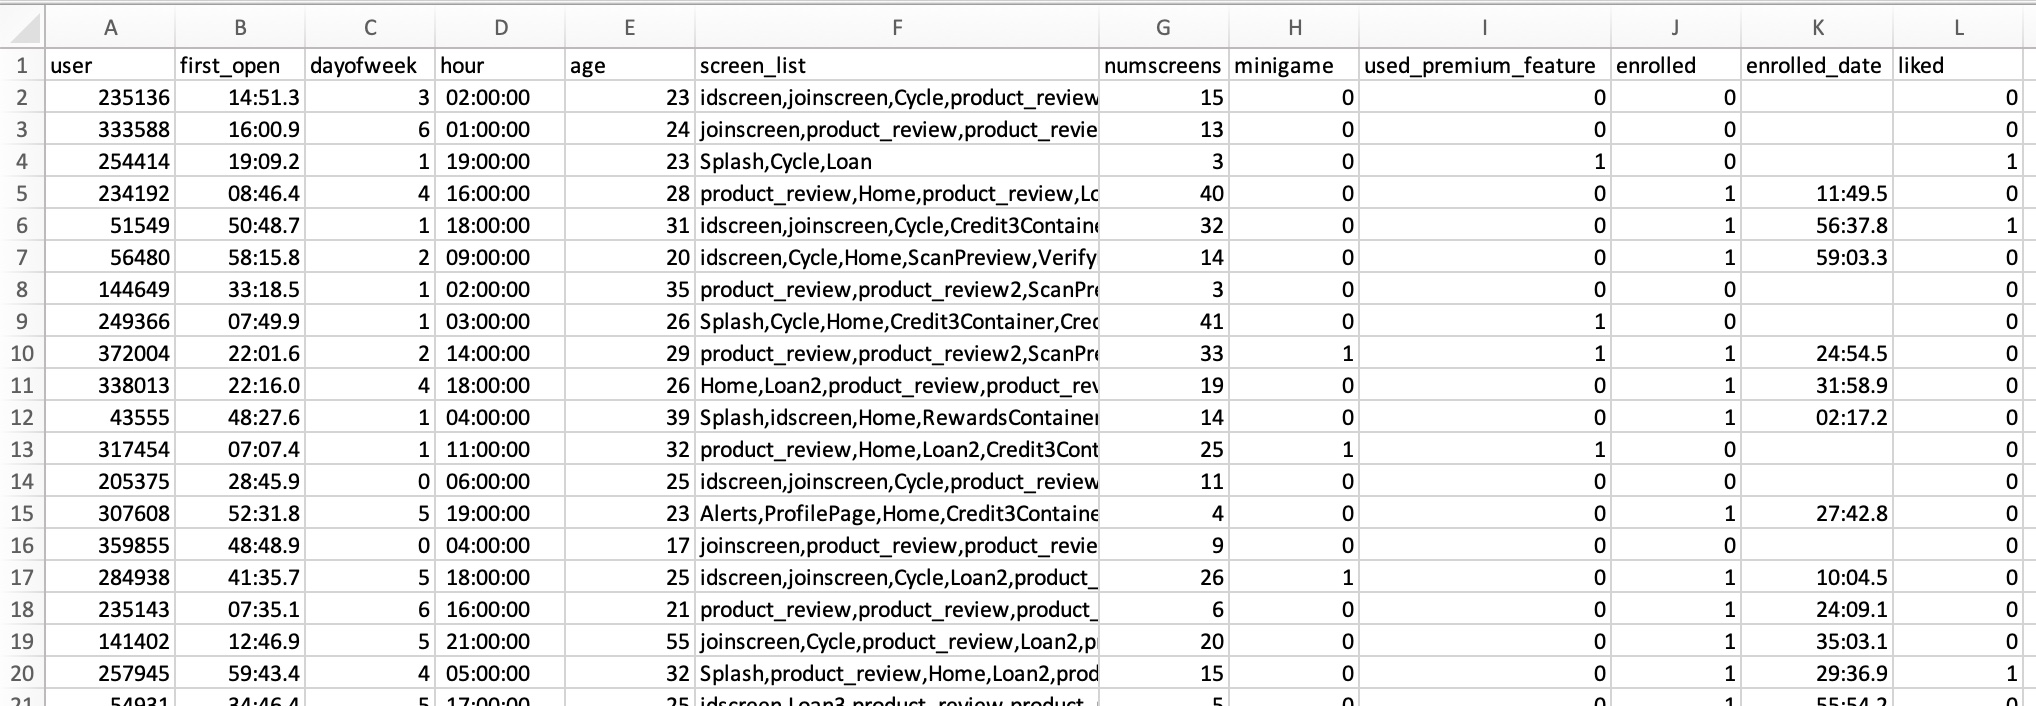
Dataset
The data for this project are manufactured fields based on trends in
real world case studies. Although the data has been artificially created,
the patterns, associations, and distributions are not random. A lot of data pre-processing
is needed before I start building model.
Features and Label
The company provides its customer with a 24-hour free trial of the premium features.
Label:
Enrolled: 0 = not enrolled, 1 = enrolled. Did customers pay for the premium features after the free trial.
Features:
First Open: When customers started using the app.
Day of Week: 0 = Sunday, 1 = Monday.
Hour: The time when customers opened the app.
Age: Age of the customers
Screen List: The pages of the app that customers have viewed.
Nums Screens: Total number of screens that customers have viewed.
Mini Game: Did customers play the mini-game in the app.
Used Premium Features: Did customers use premium or not.
Enrolled Date: When customers chose to enroll.
Liked: Did customers like any content in the app.
Exploratory data analysis
I always explore my dataset before I start doing anything. There is a Chinese saying "Sharpening your ax will not delay your job of chopping wood"
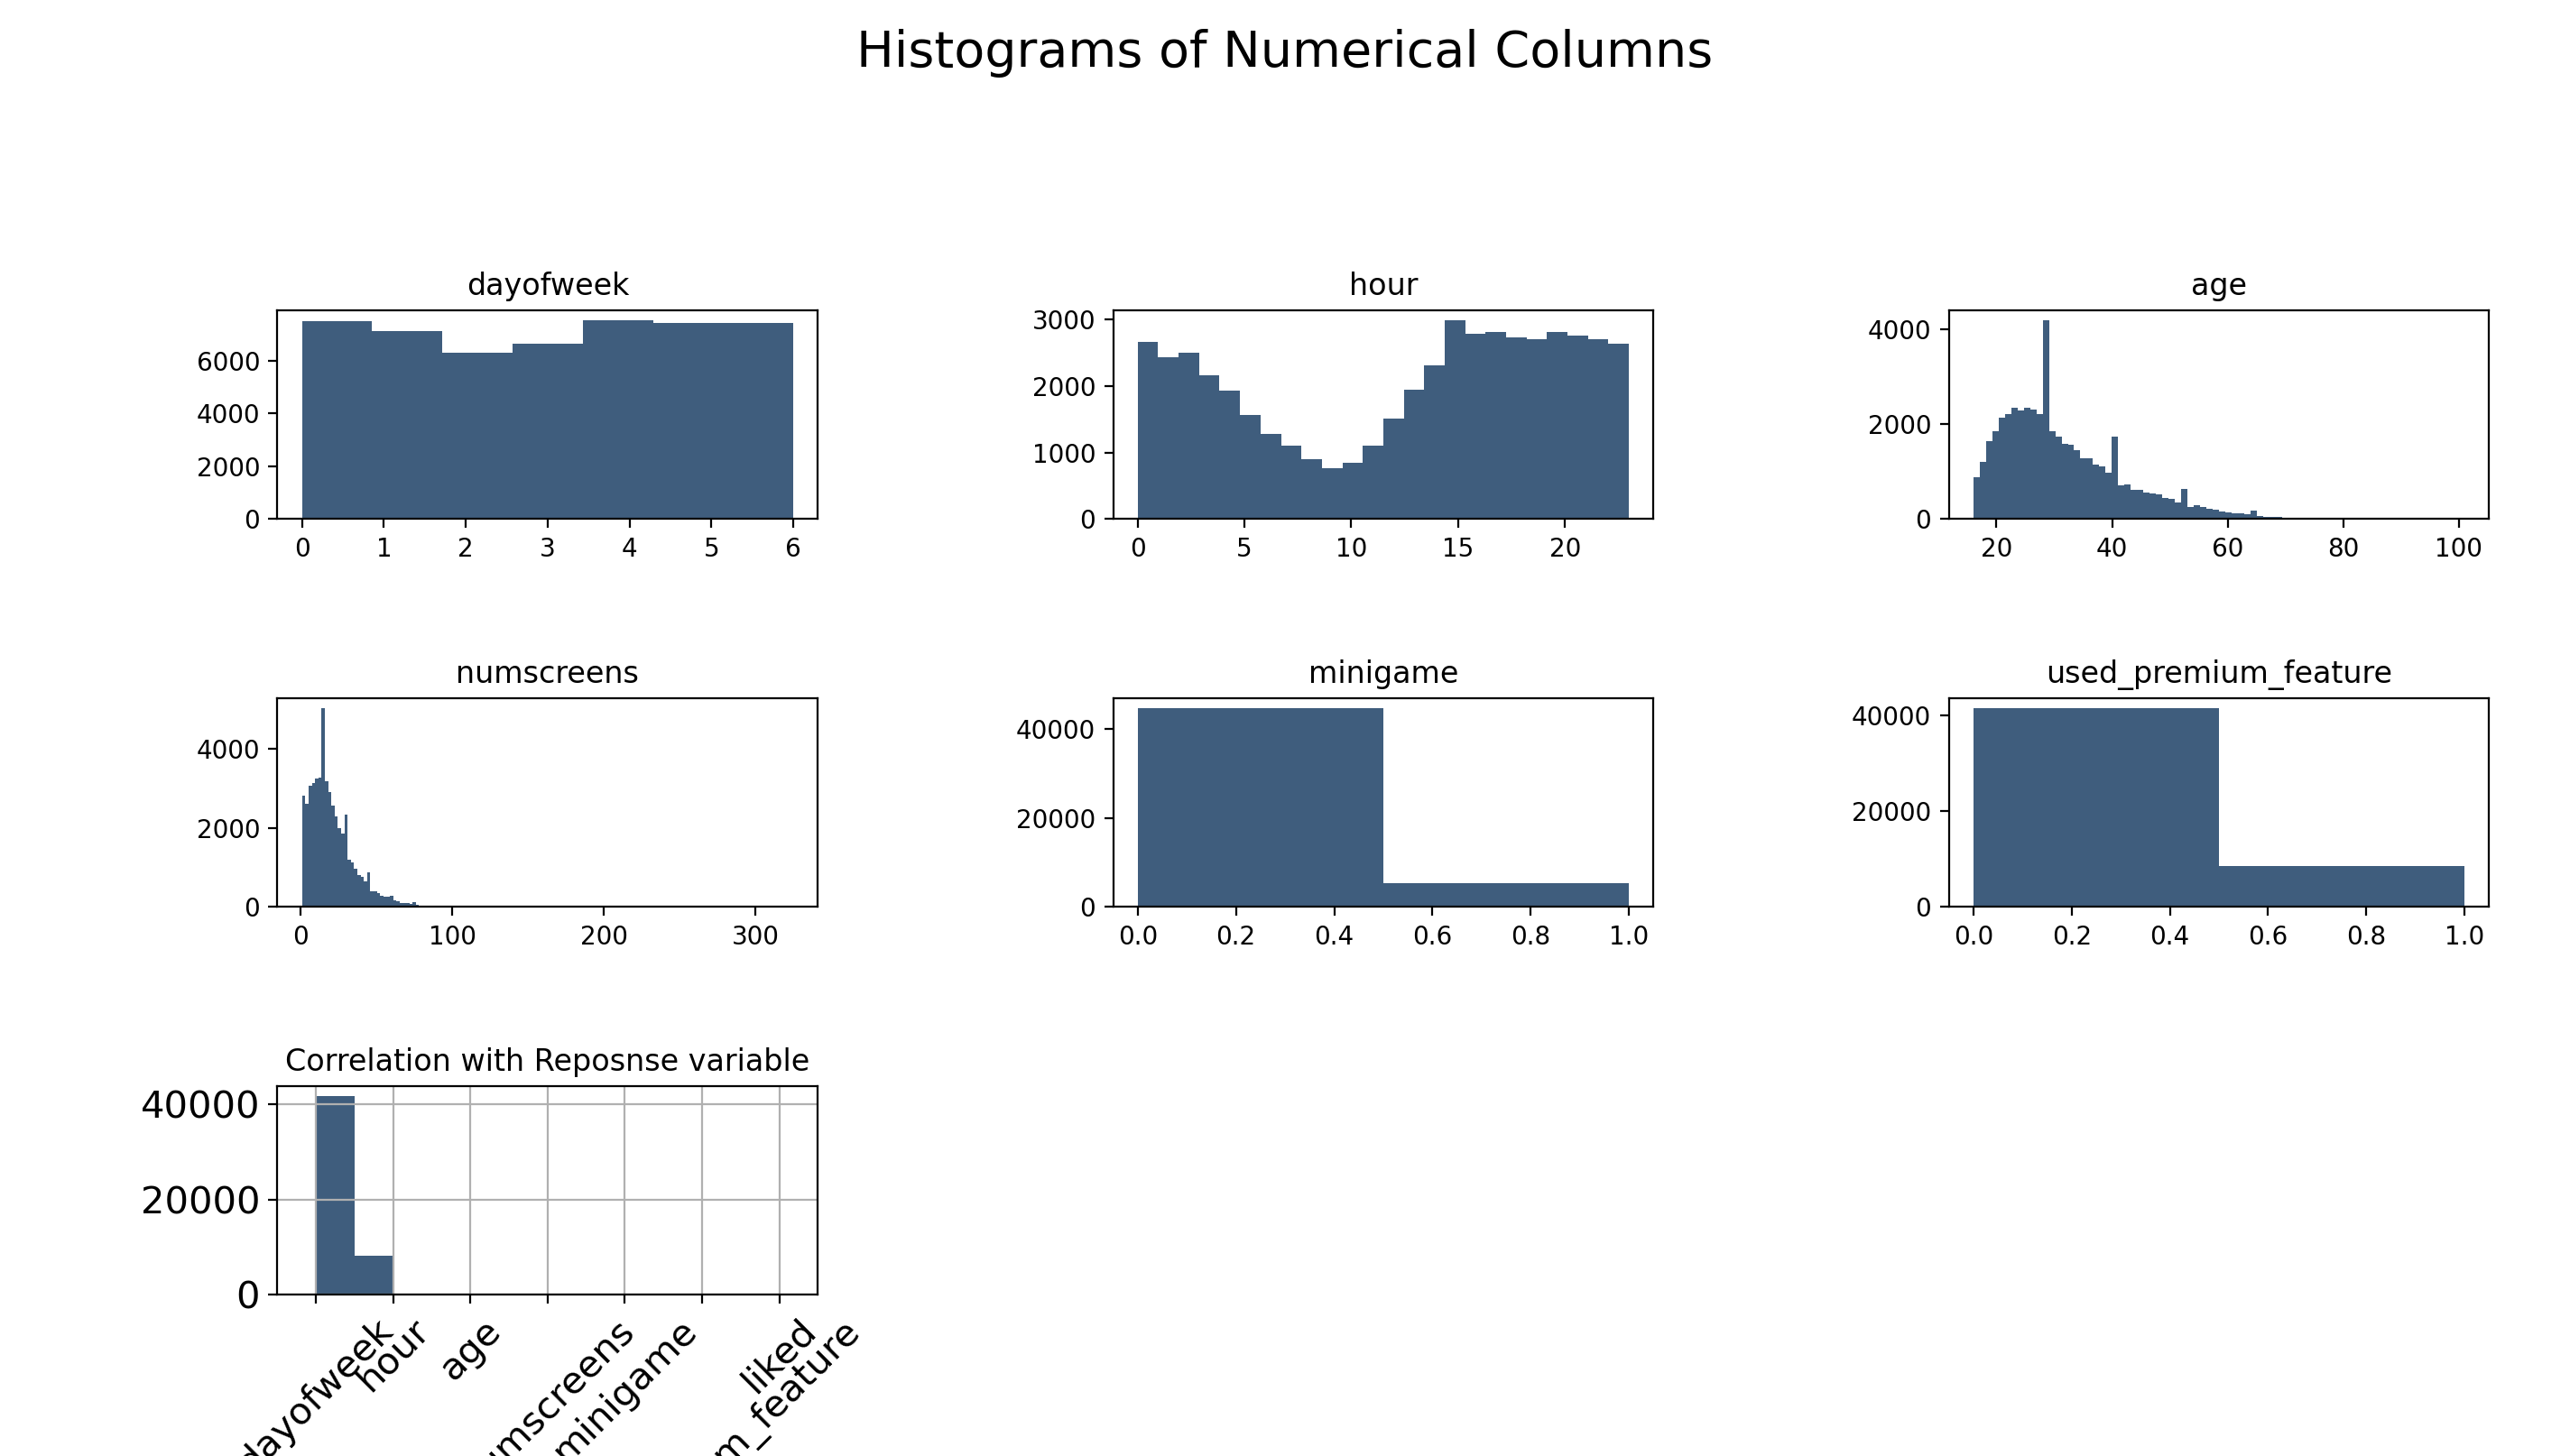
I first created some histograms of the numerical features. You get some useful information immediately.
You can see when people start using the app. The main age group is 20 to 40. People usually view about
20 pages in the app. Most people did not play the mini-game and use the premium features.
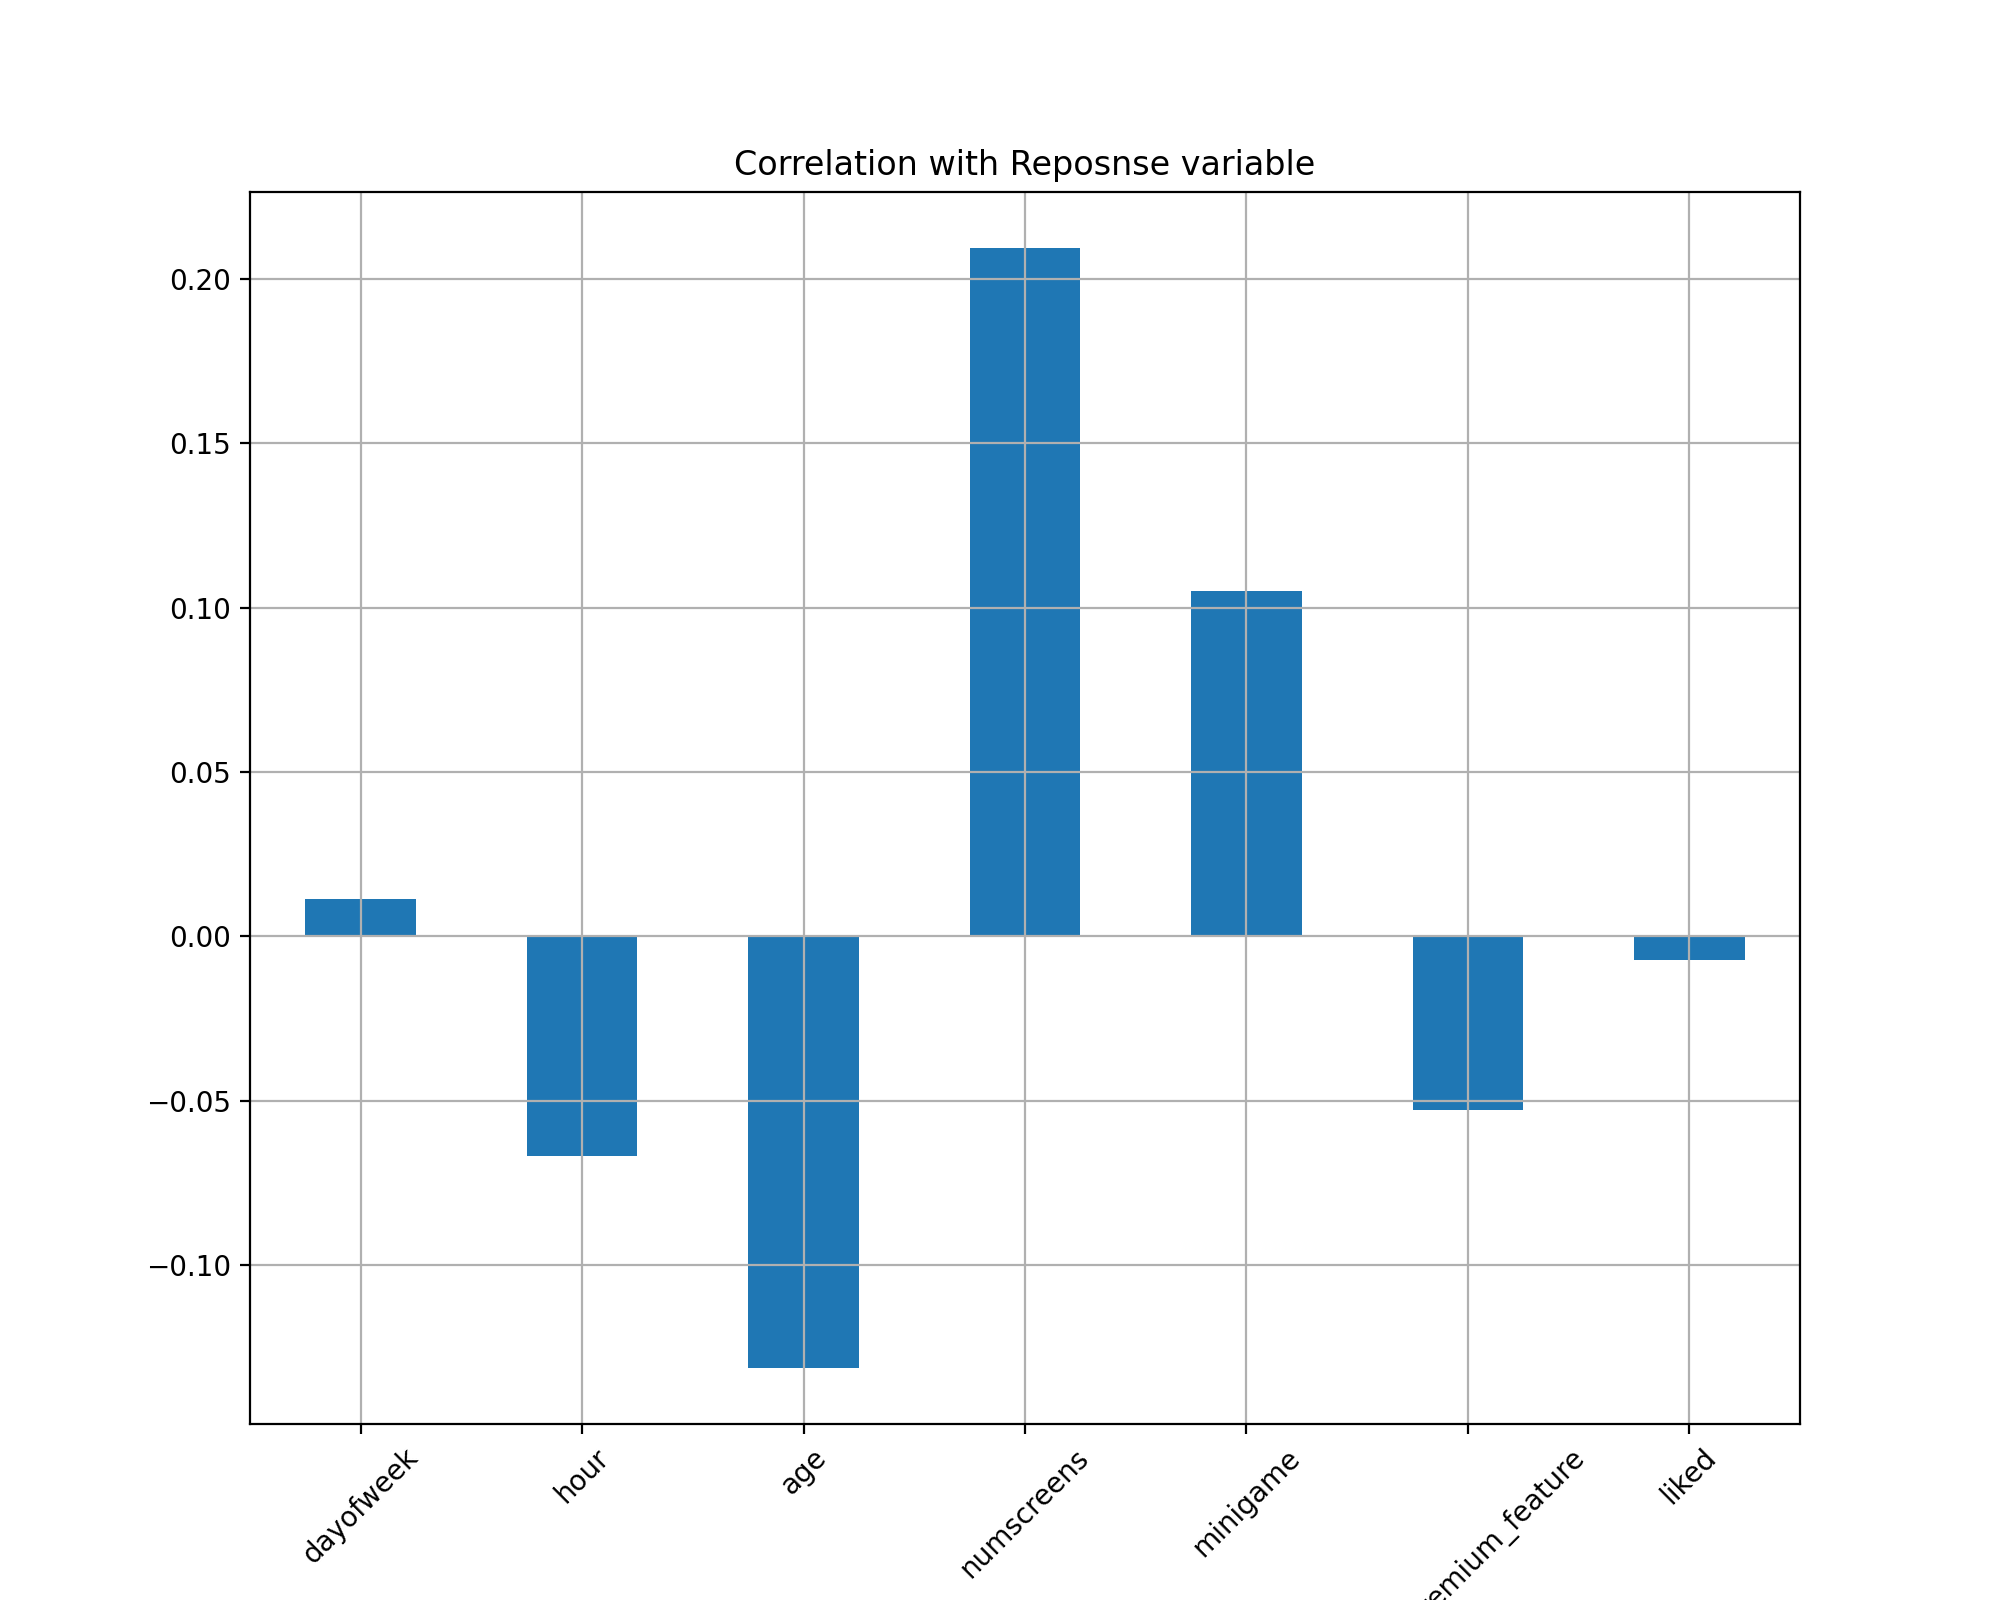
In this bar chart, it's easy to see the correlation of the enrolled variable between different variables.
Hour and age have a negative correlation. The total number of screen pages that customers viewed has
the strongest correlation. Also, if the customer has played the mini-game, he is very likely to enroll
in the program. Surprisingly, people who have tried the premium features and liked the content in the app are not
likely to pay in the end.
This correlation table between features also provides us with a lot of information. Older
people tend to visit fewer pages than young people. Users who played the mini-game would like to
try the premium features.
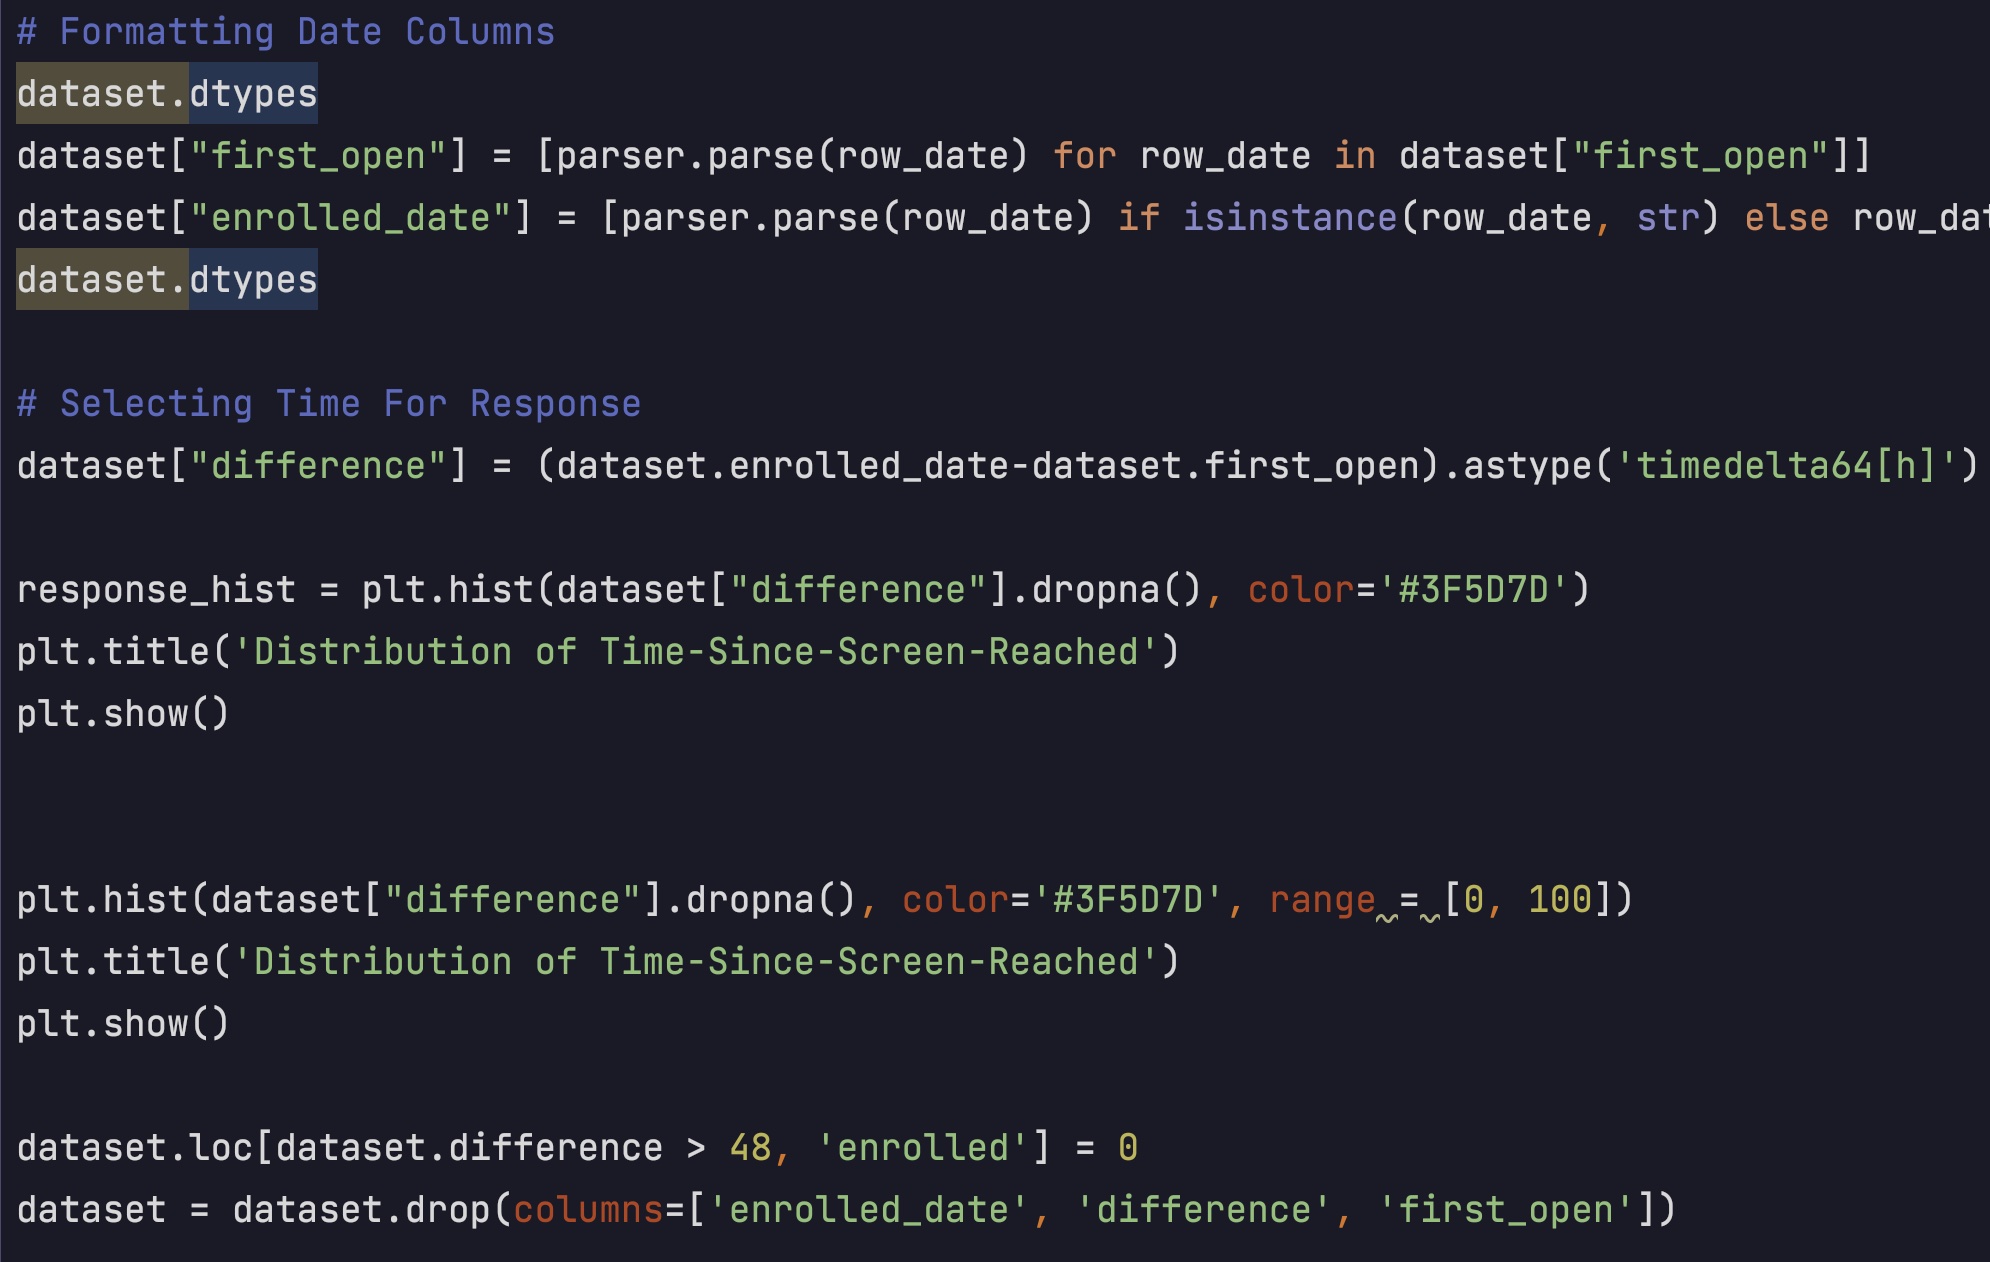
Data Cleaning
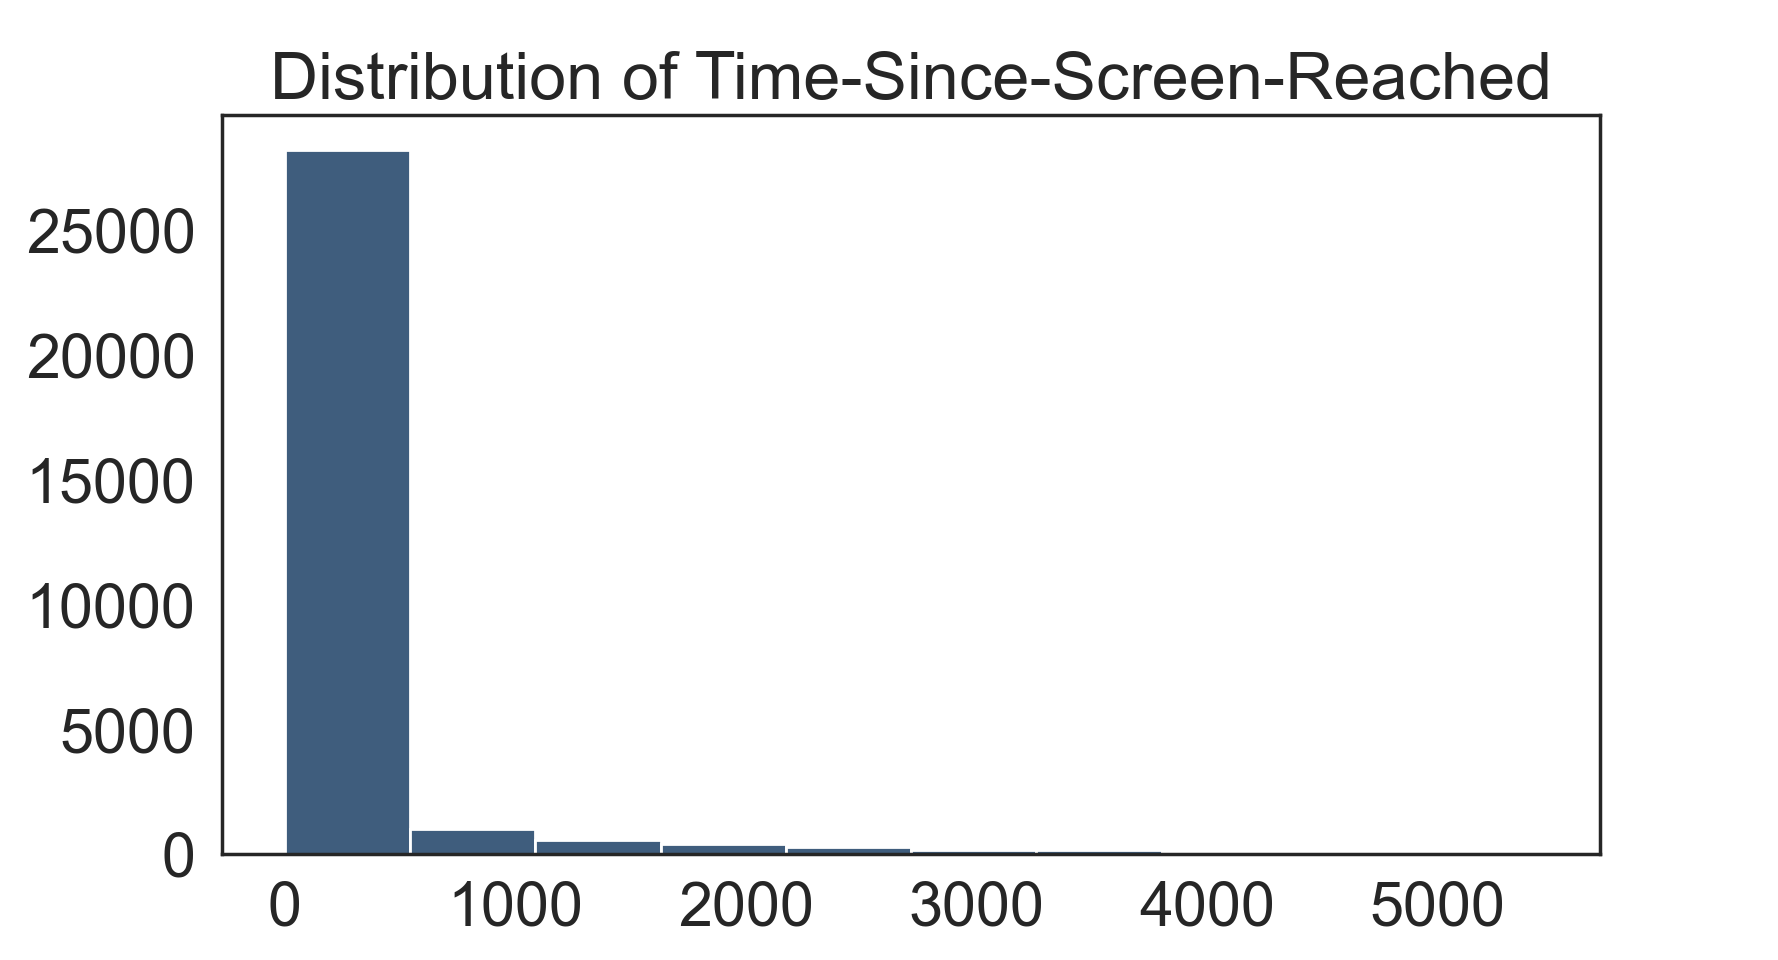
I wanted to know how long did the customers stay in the app. By changing the data type of
the first open and enrolled variables, I could get the time that our customers have spent before
they chose to enroll in the premium program.
In this histogram, we can see most customers have spent less than 500 hours.
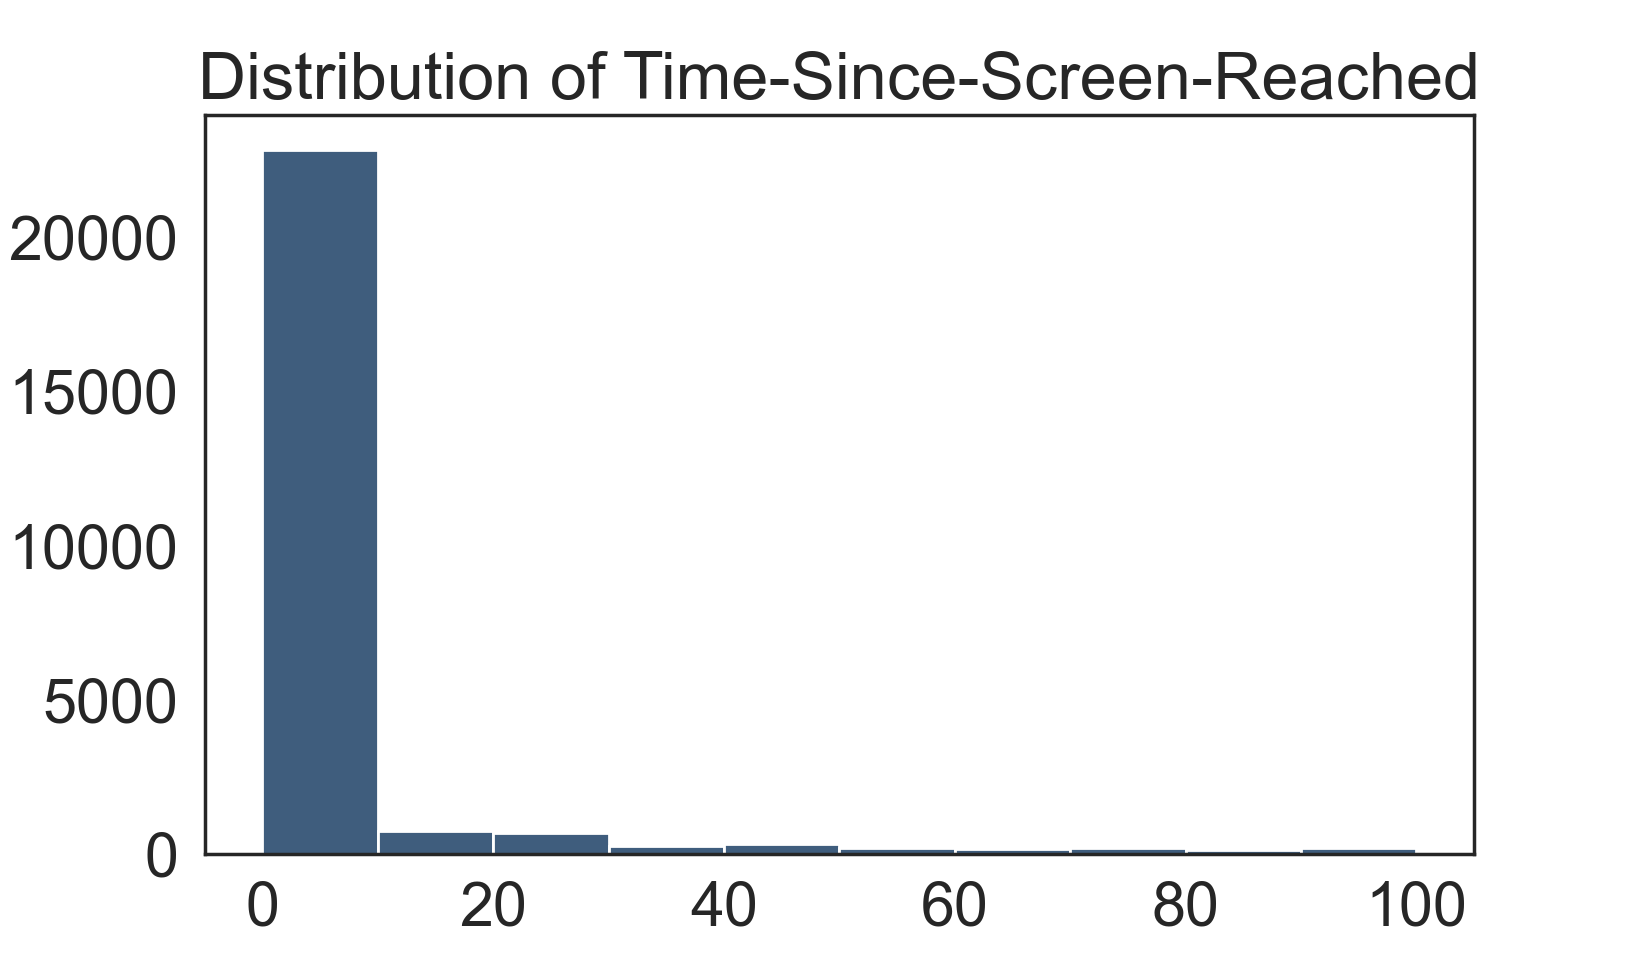
Only using the range between 0 and 100, I could see most people used the app less than 48 hours.
Then I chose to use the people who enrolled in 48 hours as our new label.
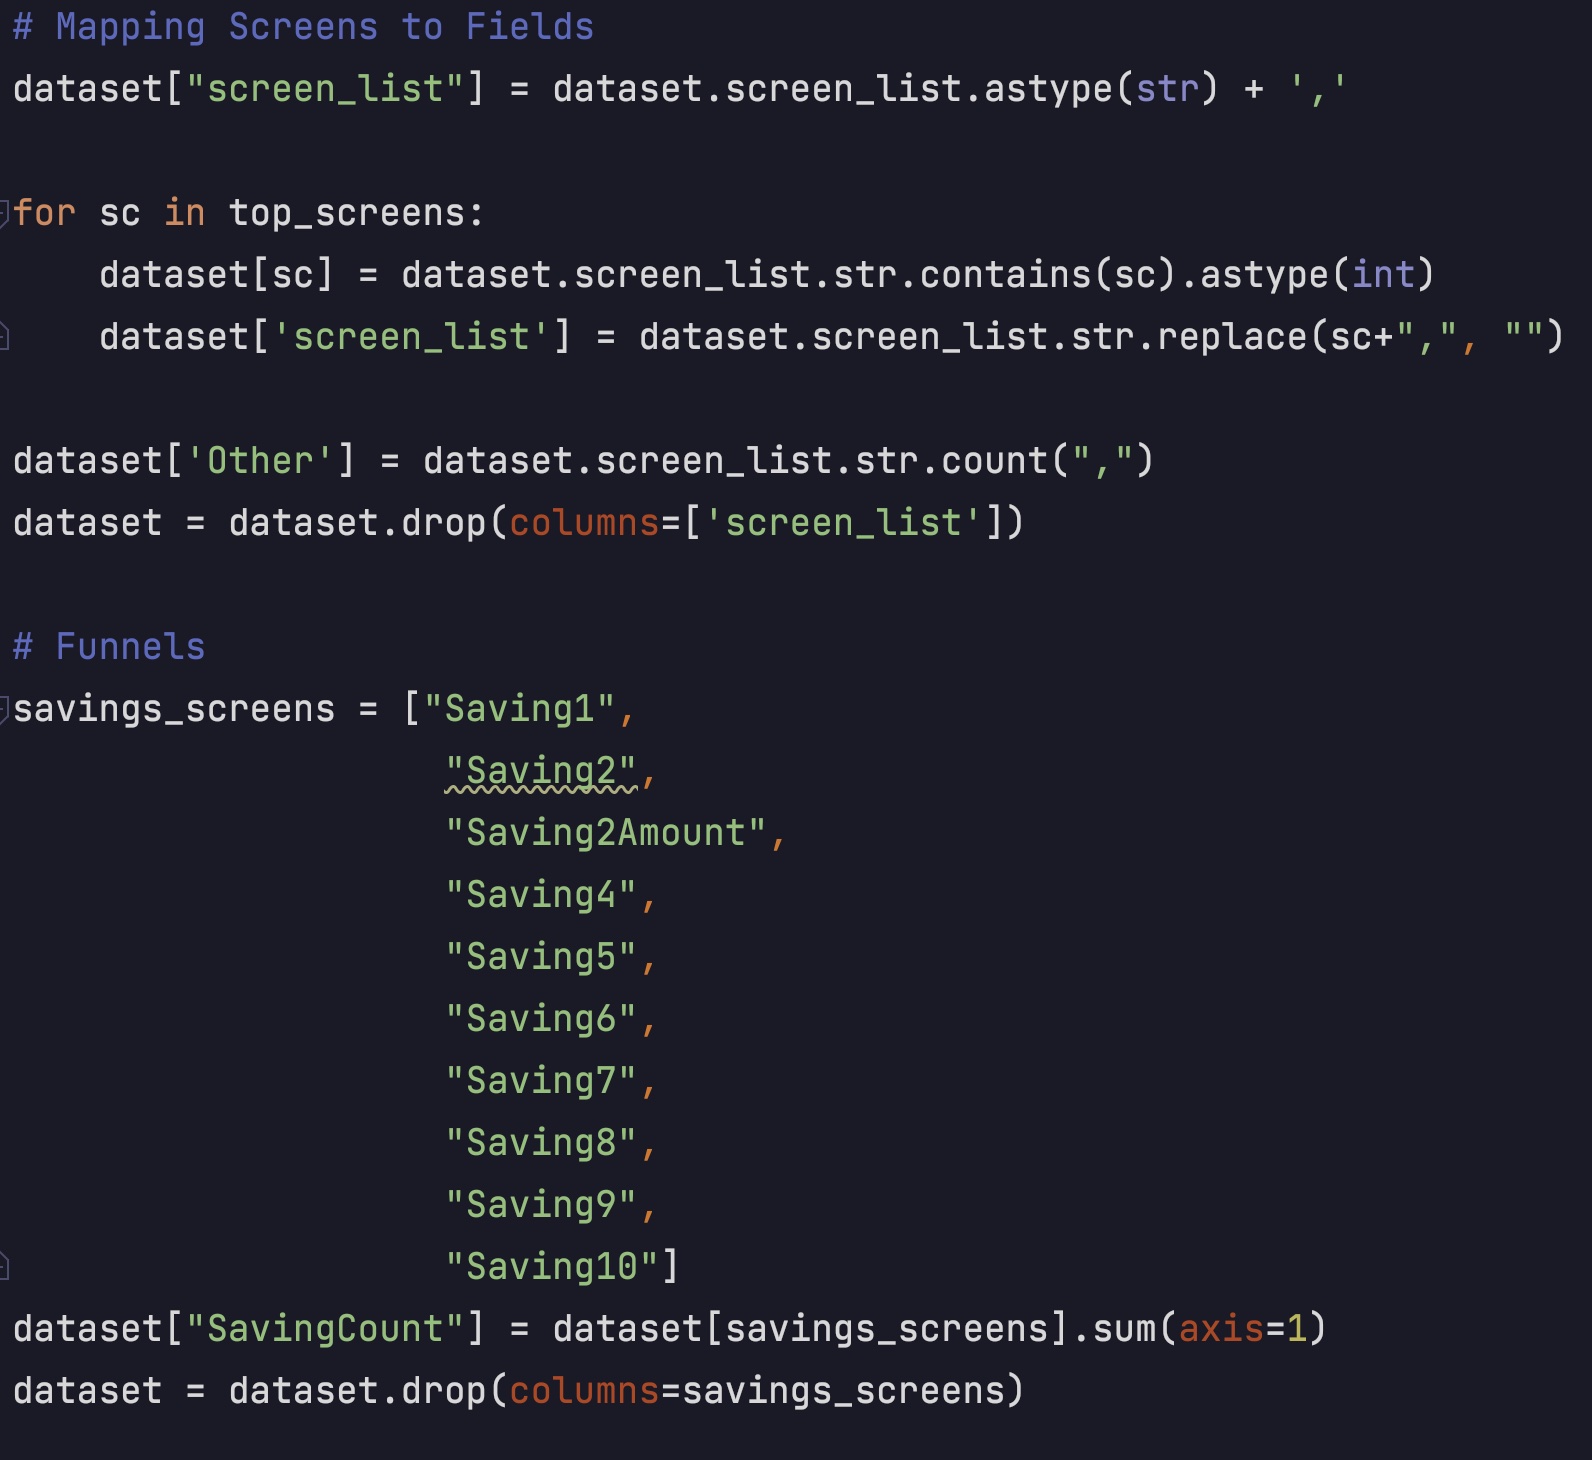
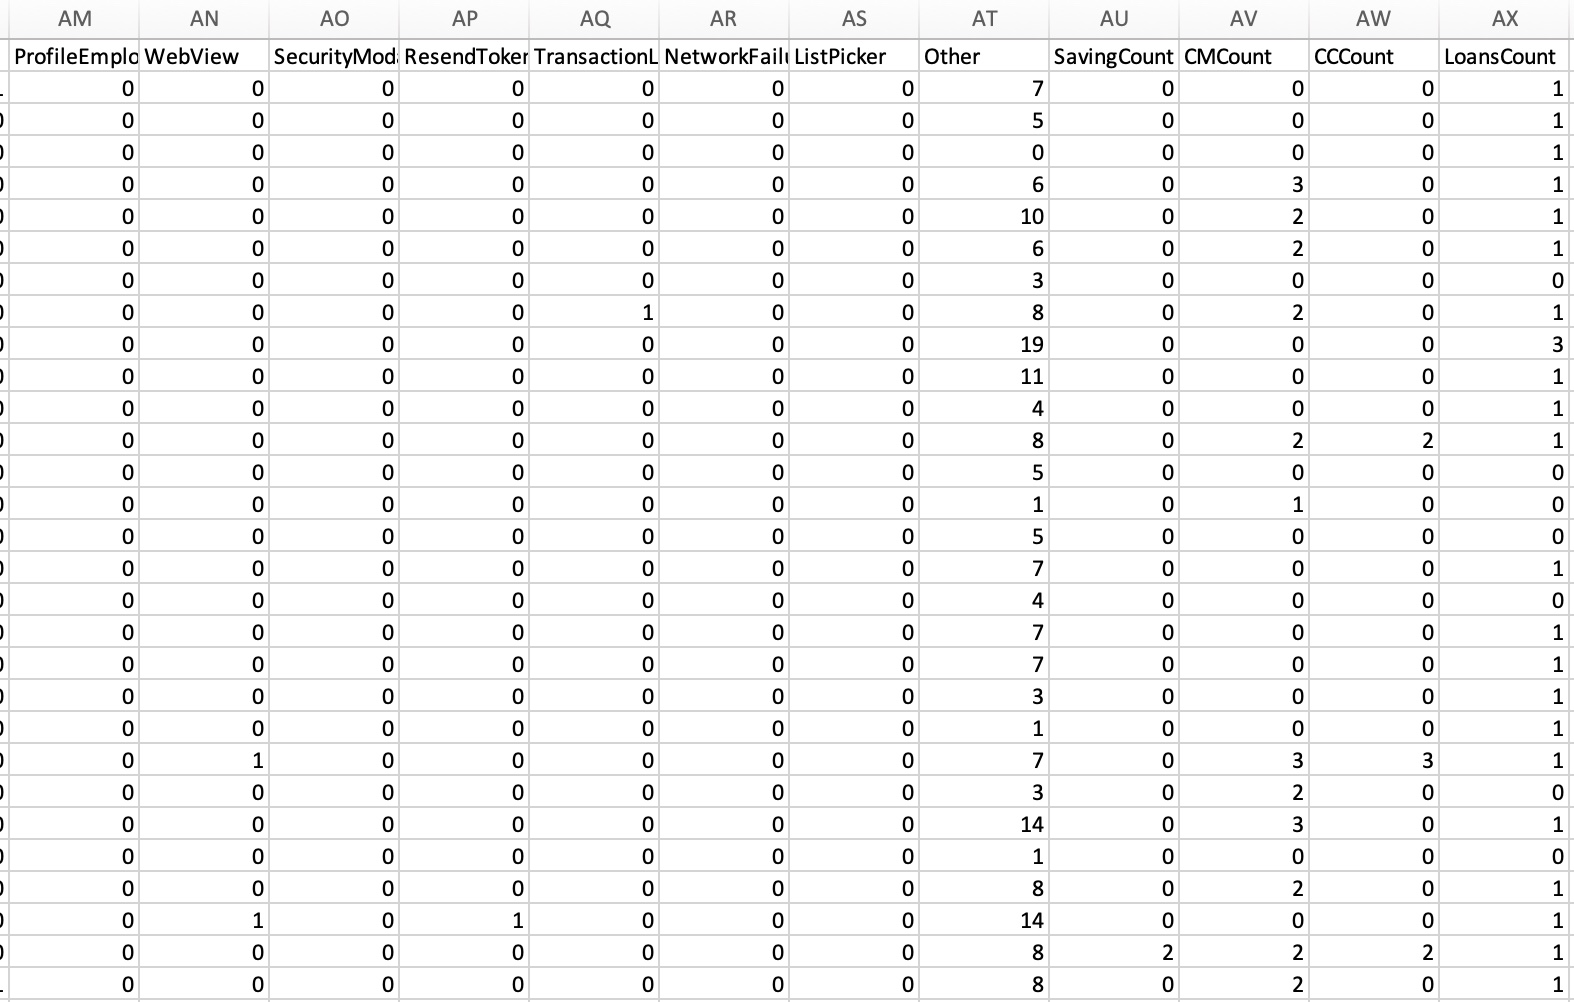
I also combined several features and changed the pages into dummy variables.
Models
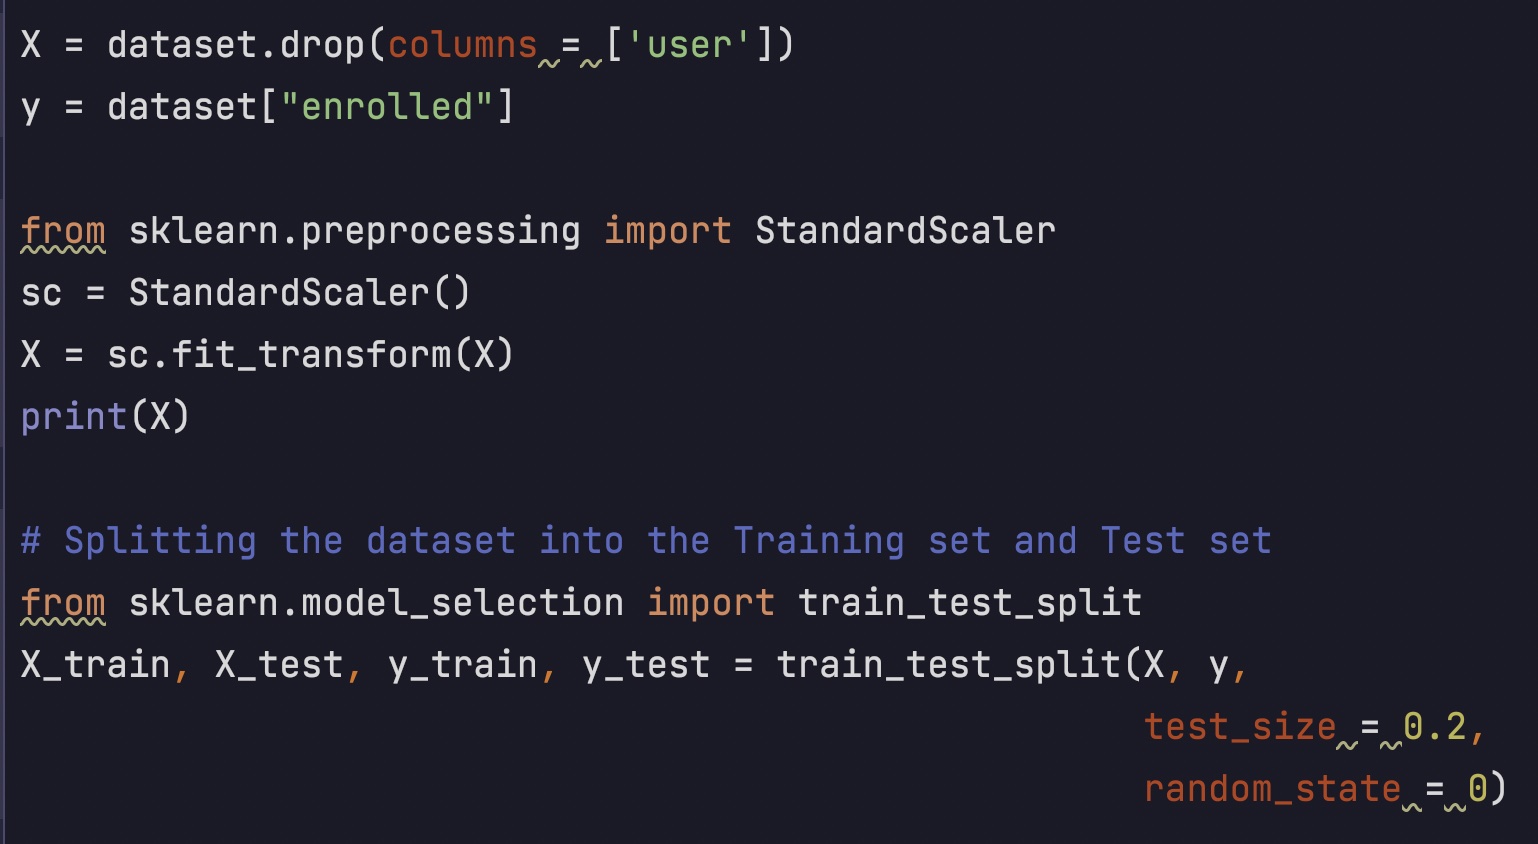
I scaled the model and split the data frame into the features and the label. Then I split them into
training and testing datasets.
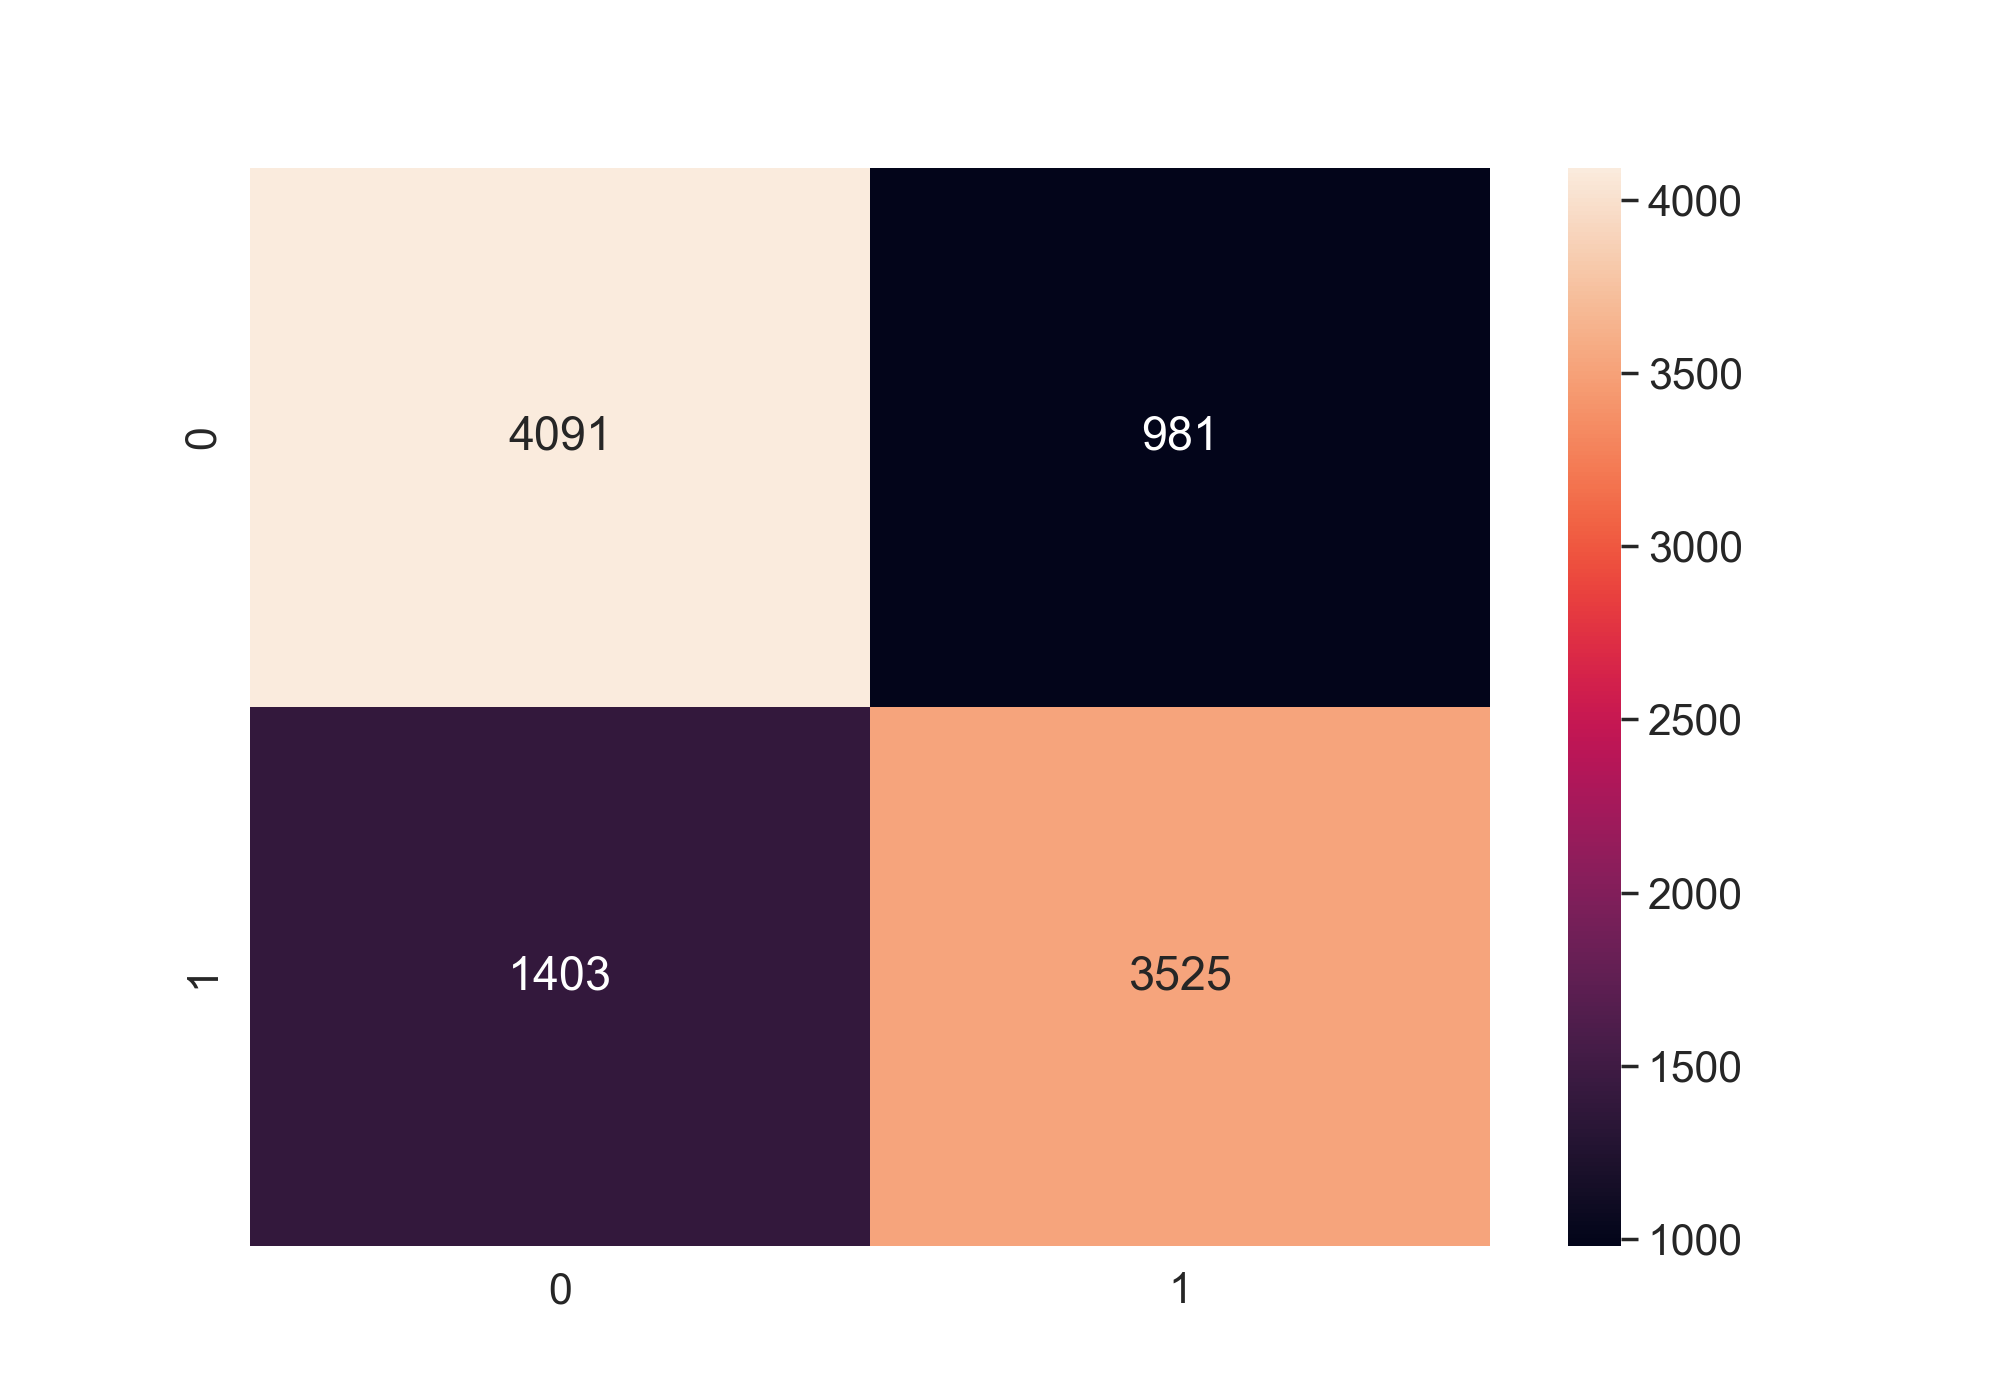
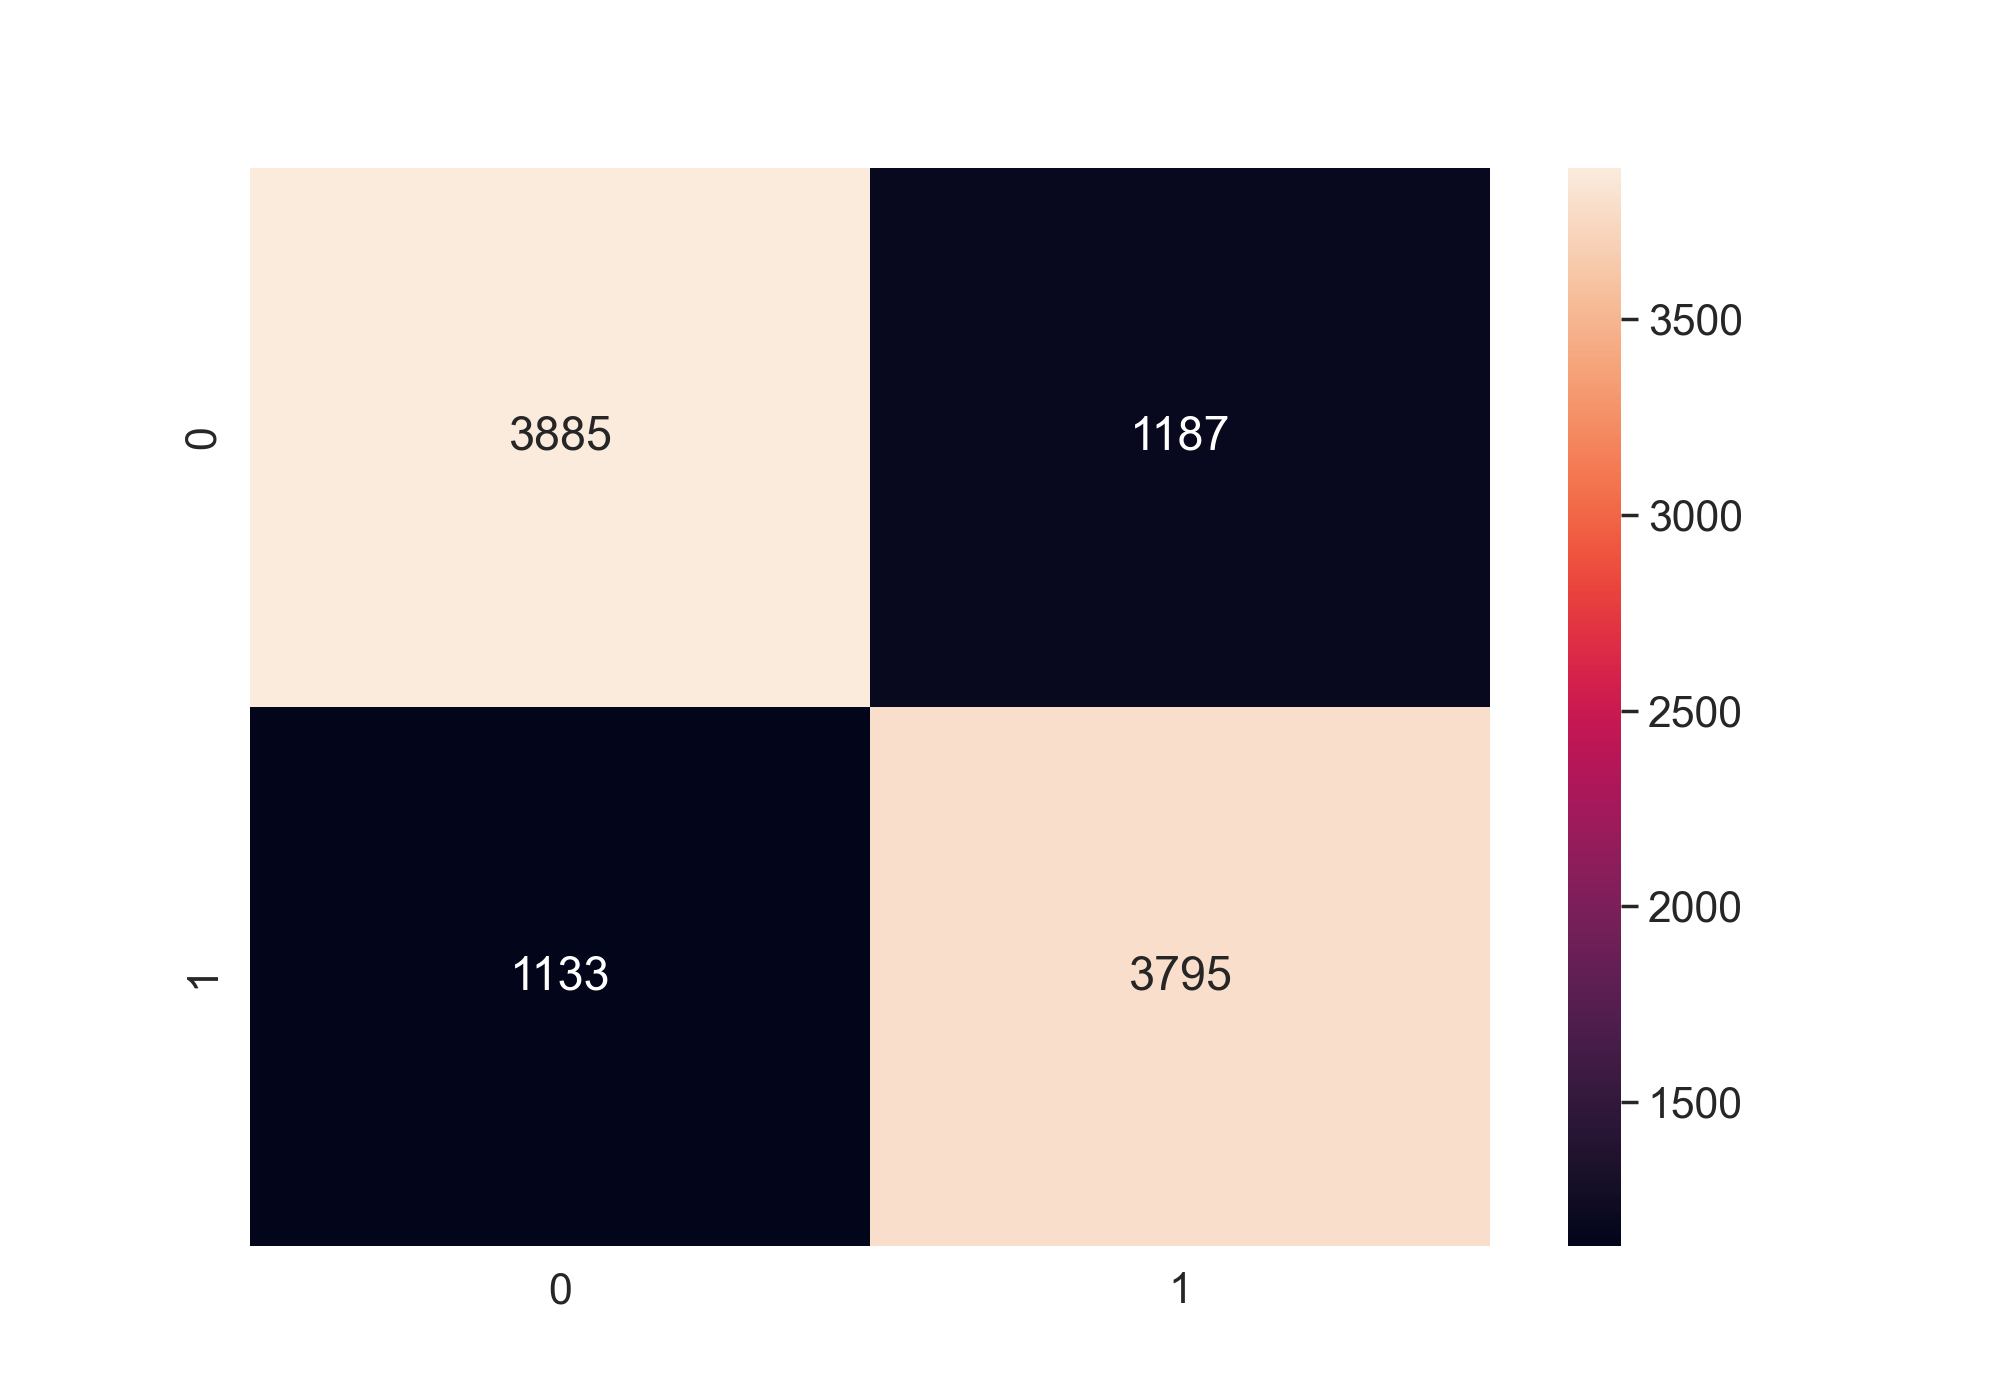
By using the logistic regression model and random forest model, I got a 76% accuracy. The
confusion matrices below show the results of the logistic regression model and random forest model respectively.
Model Tuning
I performed K-fold cross-validation to check my models and used grid-search to find the best parameters for
the models. Also, I used l2 regularization in my logistic regression model to avoid dependent variables.
The accuracy and f1 score have increased a little, but not too much.
Final Model
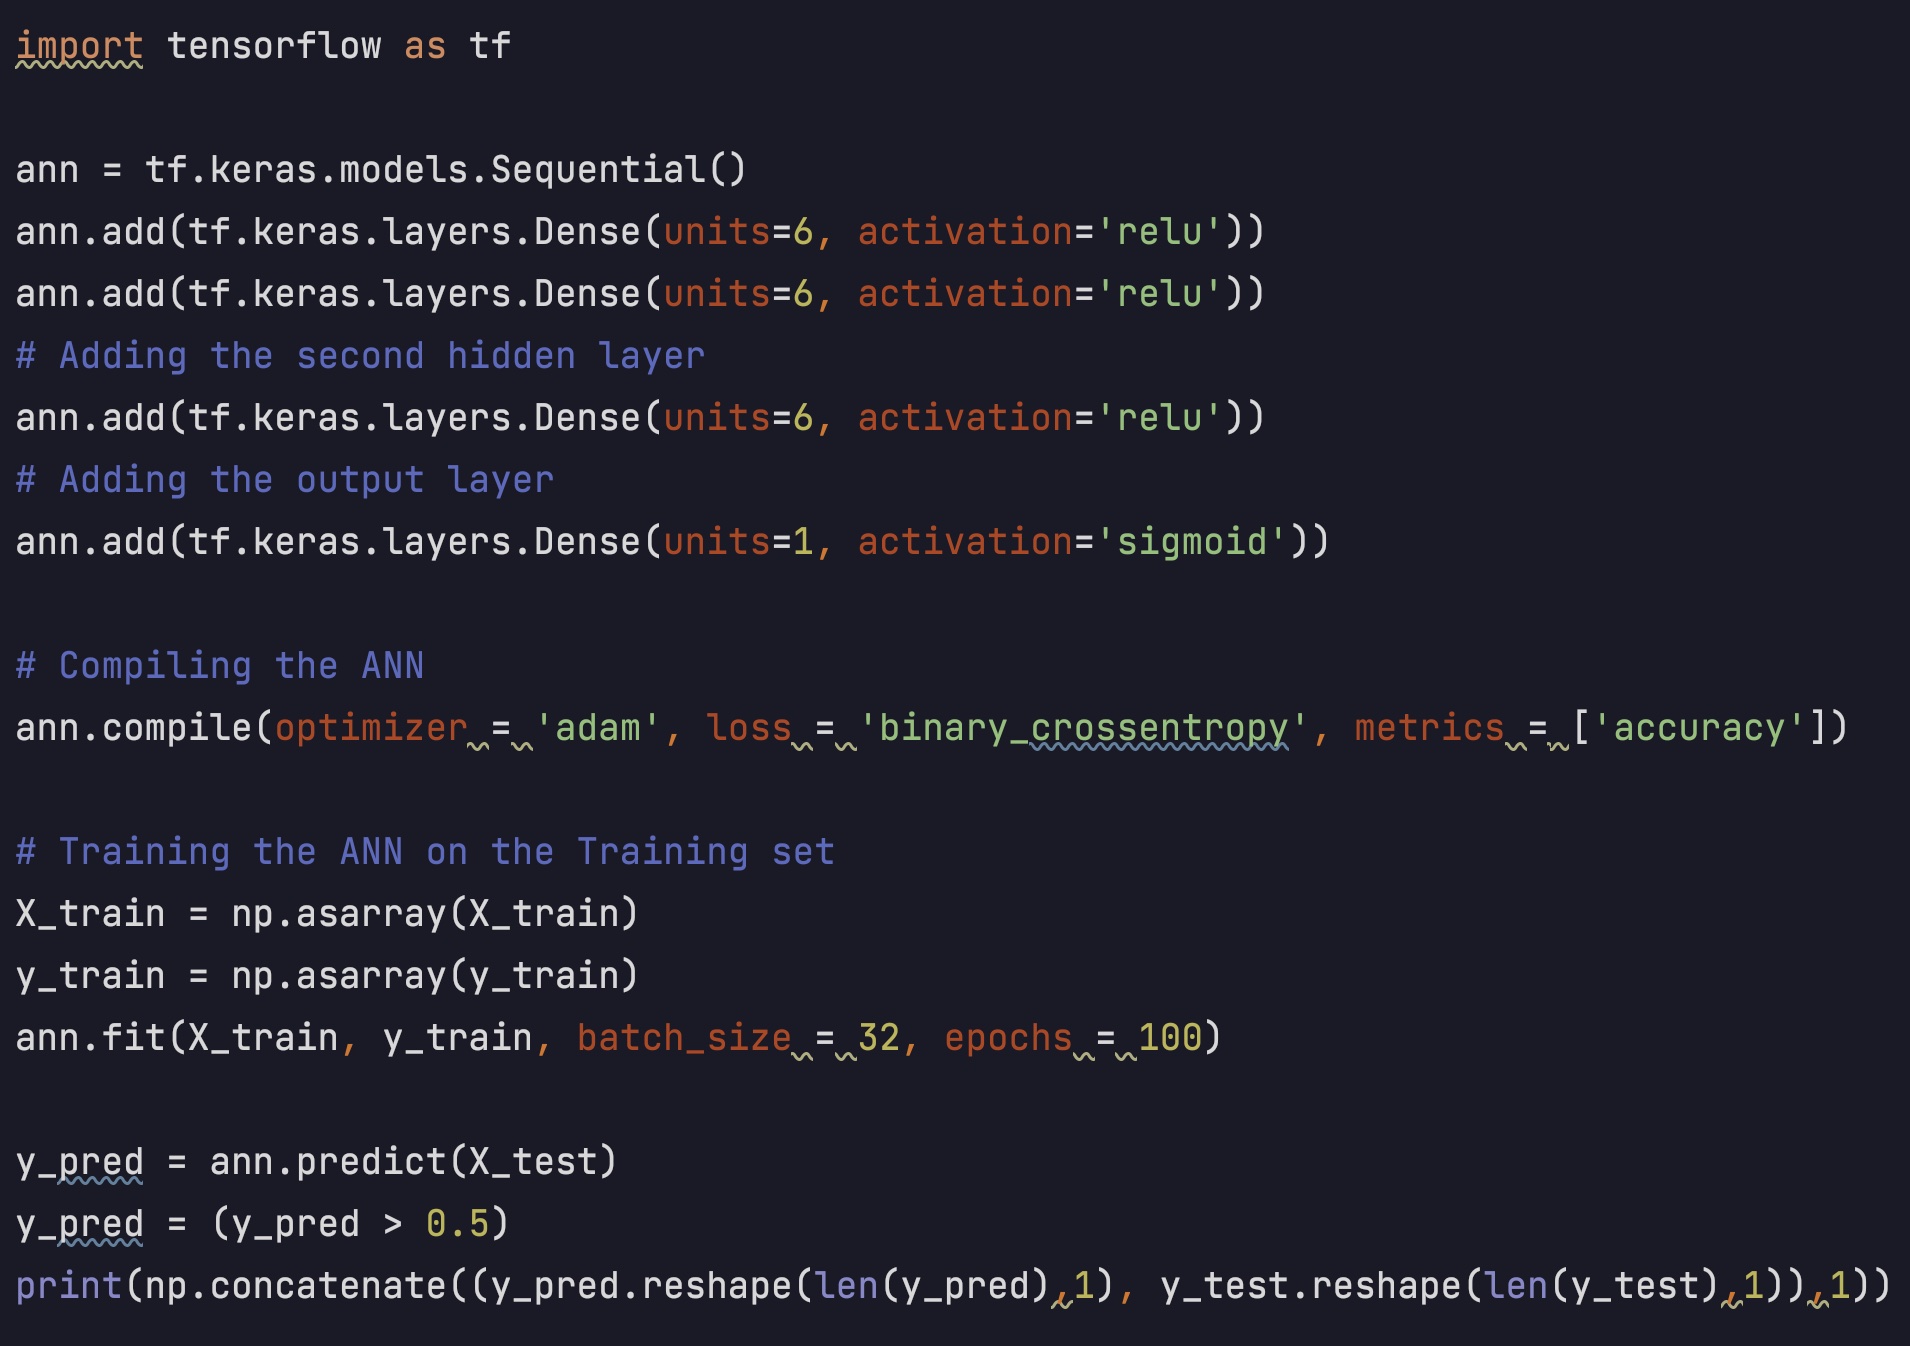
Even though 76% accuracy is very good, I still want to improve my model. I chose to
use Artificial Neural Network (ANN) to classify my dataset.
Surprisingly, the ANN model reached 100% accuracy after the second epoch. In the end, I have a
100% accuracy model, which means I predicted all labels correctly in the testing dataset.
Last Thoughts
What I could've done?
1. Different Models: I could've tried SVM, KNN, decision tree, Naive Bayes, XGboost models.
2. Regularization: I did not apply regularization in my ANN model, even though it's 100% accurate.
I could've tried dropout and early stopping to avoid overfitting.
3. Features Selection:
I could've applied forward feature selection, backward feature elimination, exhaustive feature selection.
Maybe I do not need these many features.
3. Target Encoding:
I could've applied target encoding, which means we calculate the mean of the target variable for each category and replace the category variable with the mean value.
Using transformed variables usually performs better in models.
Multiplicity of Good Model
According to the multiplicity of good model theory, if you have
good data and get features prepared correctly, you are ver likely to
get similar by using different models. In this case, I only got
76% accuracy by using logistic and random forest models, but I got a 100% accurate
model by using an ANN model. Did I miss anything in the original dataset?
100% Accuracy = Perfect?
It looks perfect, but does it last?
Model decay is an unavoidable problem in machine learning models.
If I were to apply this ANN model in real life, would it have 100% accuracy?
Models tend to shift or decay over time because the world is changing every day.
With a new environment and new variables, the model can be improved in the future.
I usually check my model every 6 months in practice.
Software used: Python
Packages used: Sklearn, Tensorflow, Keras, Seaborn