In this project, I worked for a fintech company that wanted to minimize the churn rate for its app.
Mainly focusing on the app features, I could help the company improve the app to keep its customers.
To create the best model, I applied feature selection, data balancing, k-fold cross-validation and some other techniques. It is very hard to predict that whether people would churn or not because the churn rate is not balanced, only about 40% of people churned. In the end, I created a model with a 64% accuracy.
Exploratory Data Analysis
I always do exploratory data analysis before I start building a model. There is a Chinese saying "Sharpening your ax will not delay your job of chopping wood"
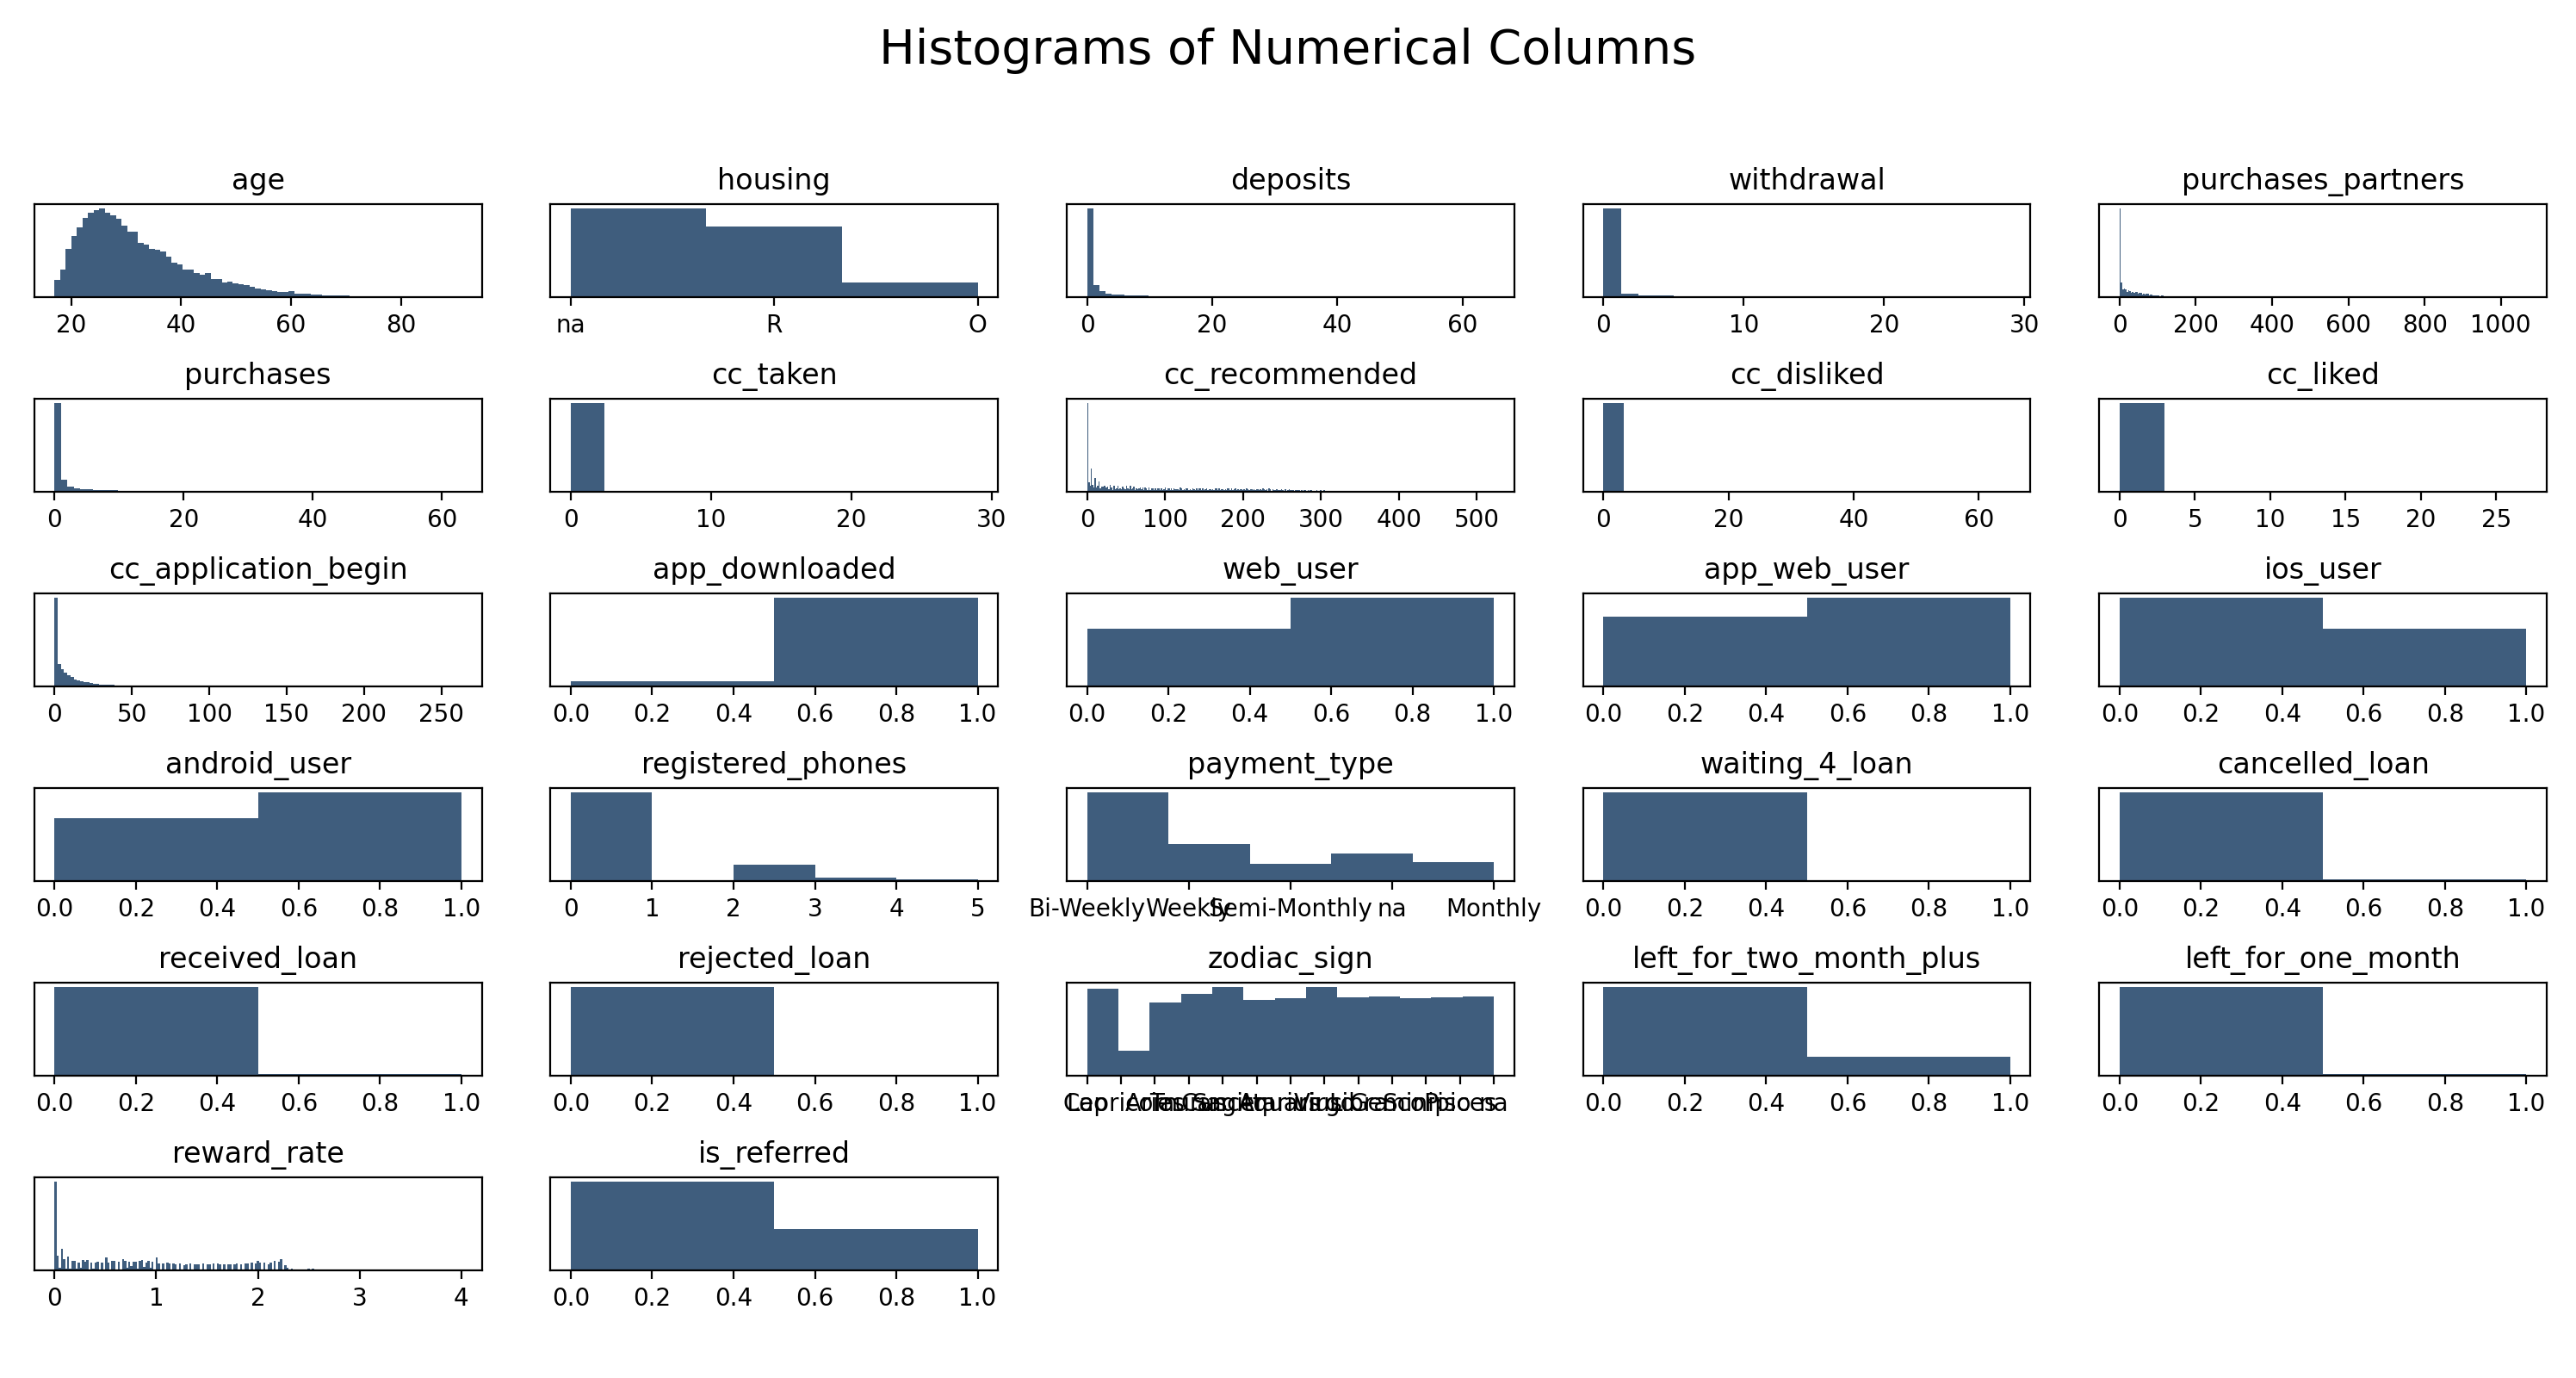
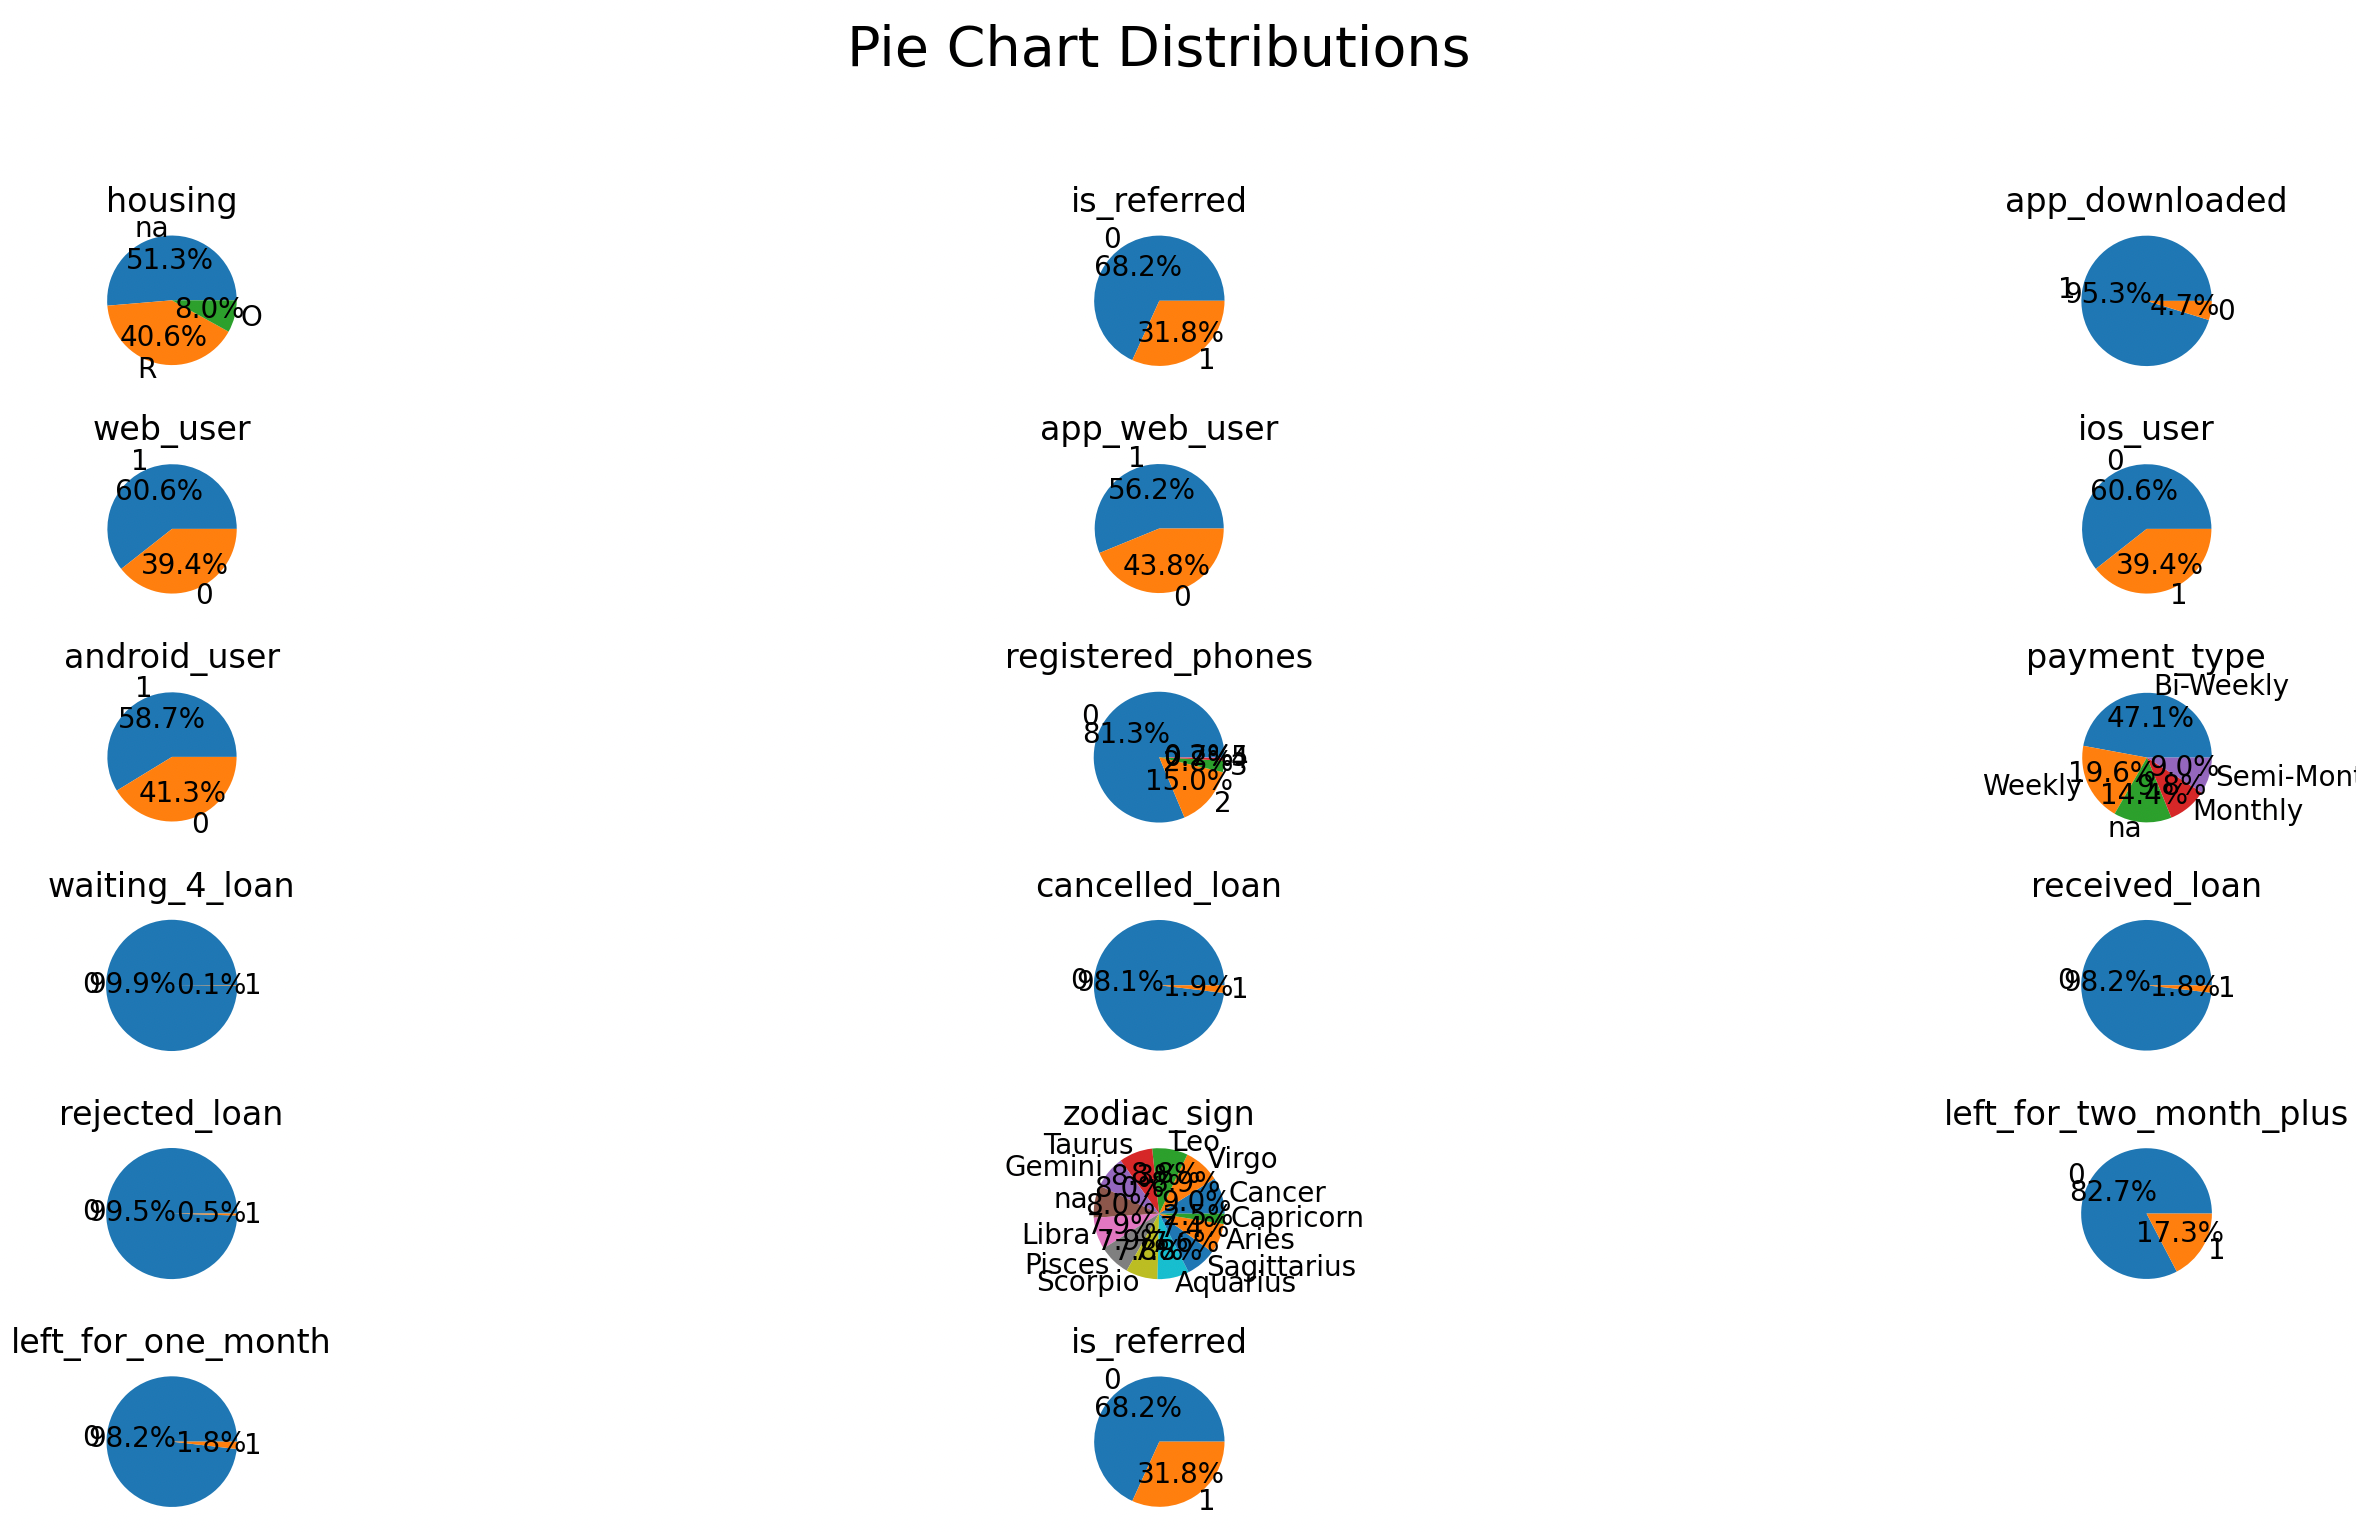
Histograms and Pie Charts
By checking histograms and pie charts, we could see many young people are using this app and most people
don't own a house. Also, I saw many features are binary, so I created some pie charts.
In some pie charts, some answers only account for a very small proportion of these features.
Then I checked are those answers highly correlated to churn.
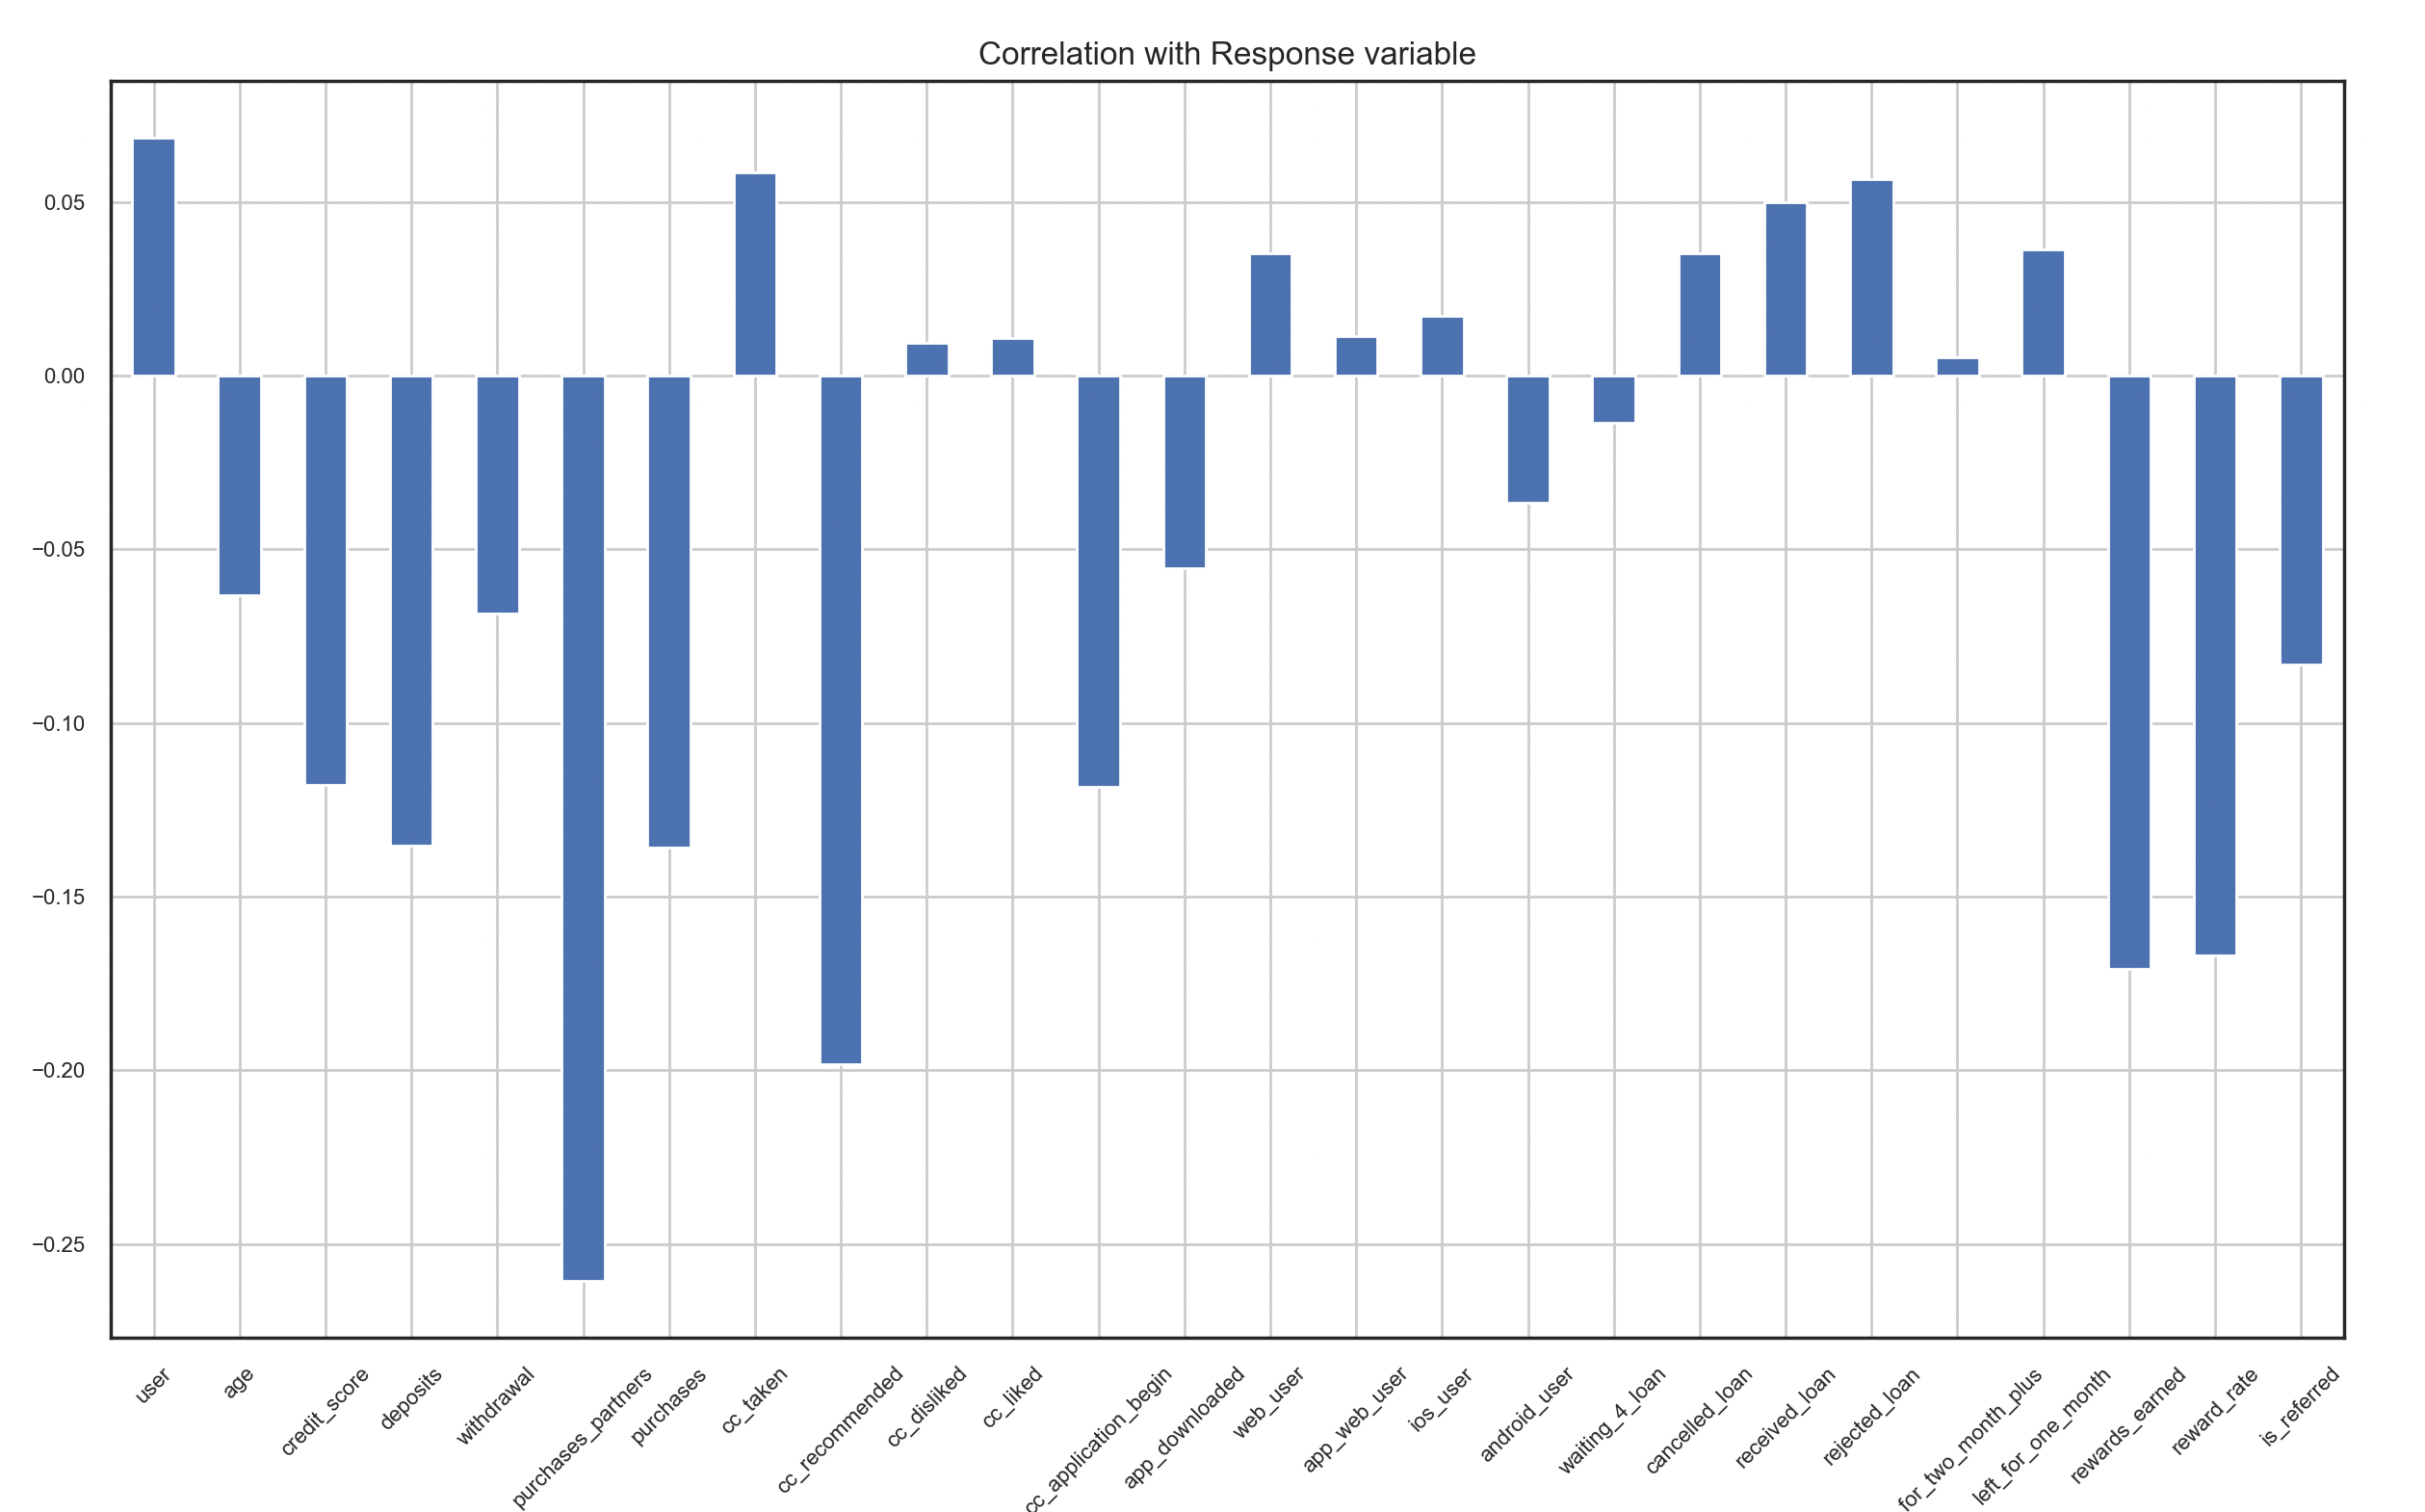
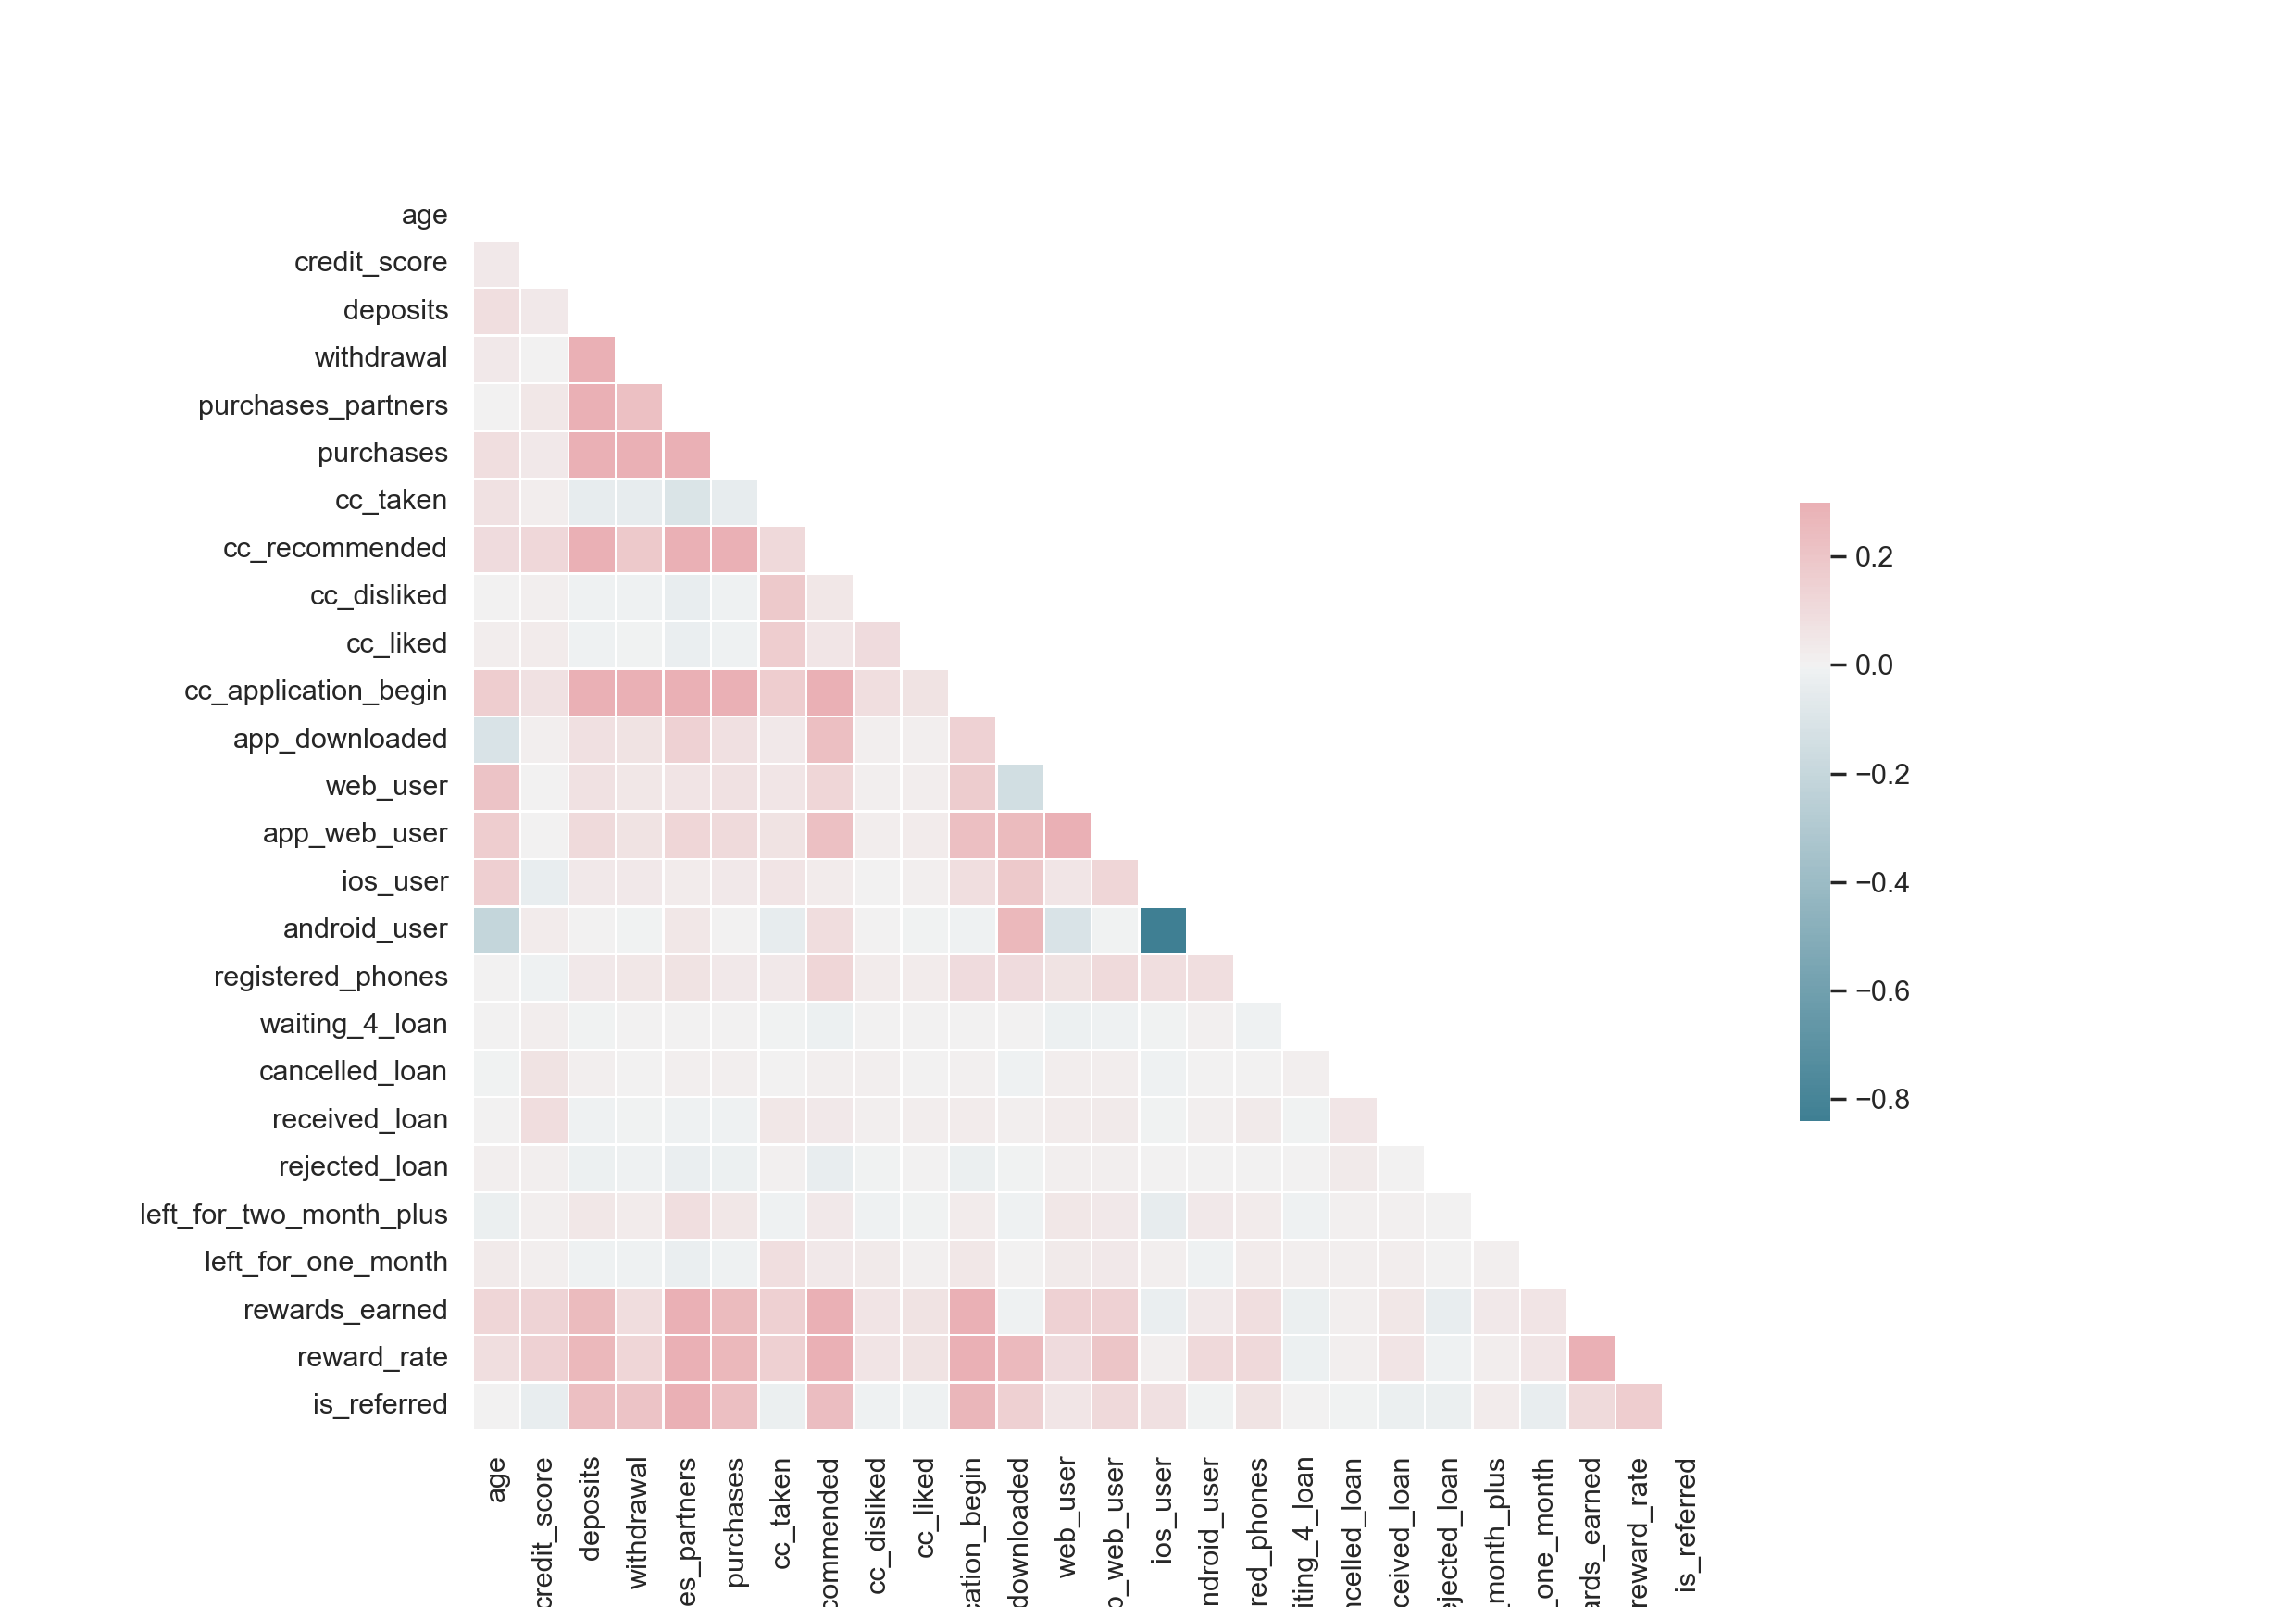
Correlation Matrix
We could get more information from the correlation matrix. iPhone users and android users are highly negatively correlated.
It makes sense because people usually use one phone, so I combined these two variables into one.
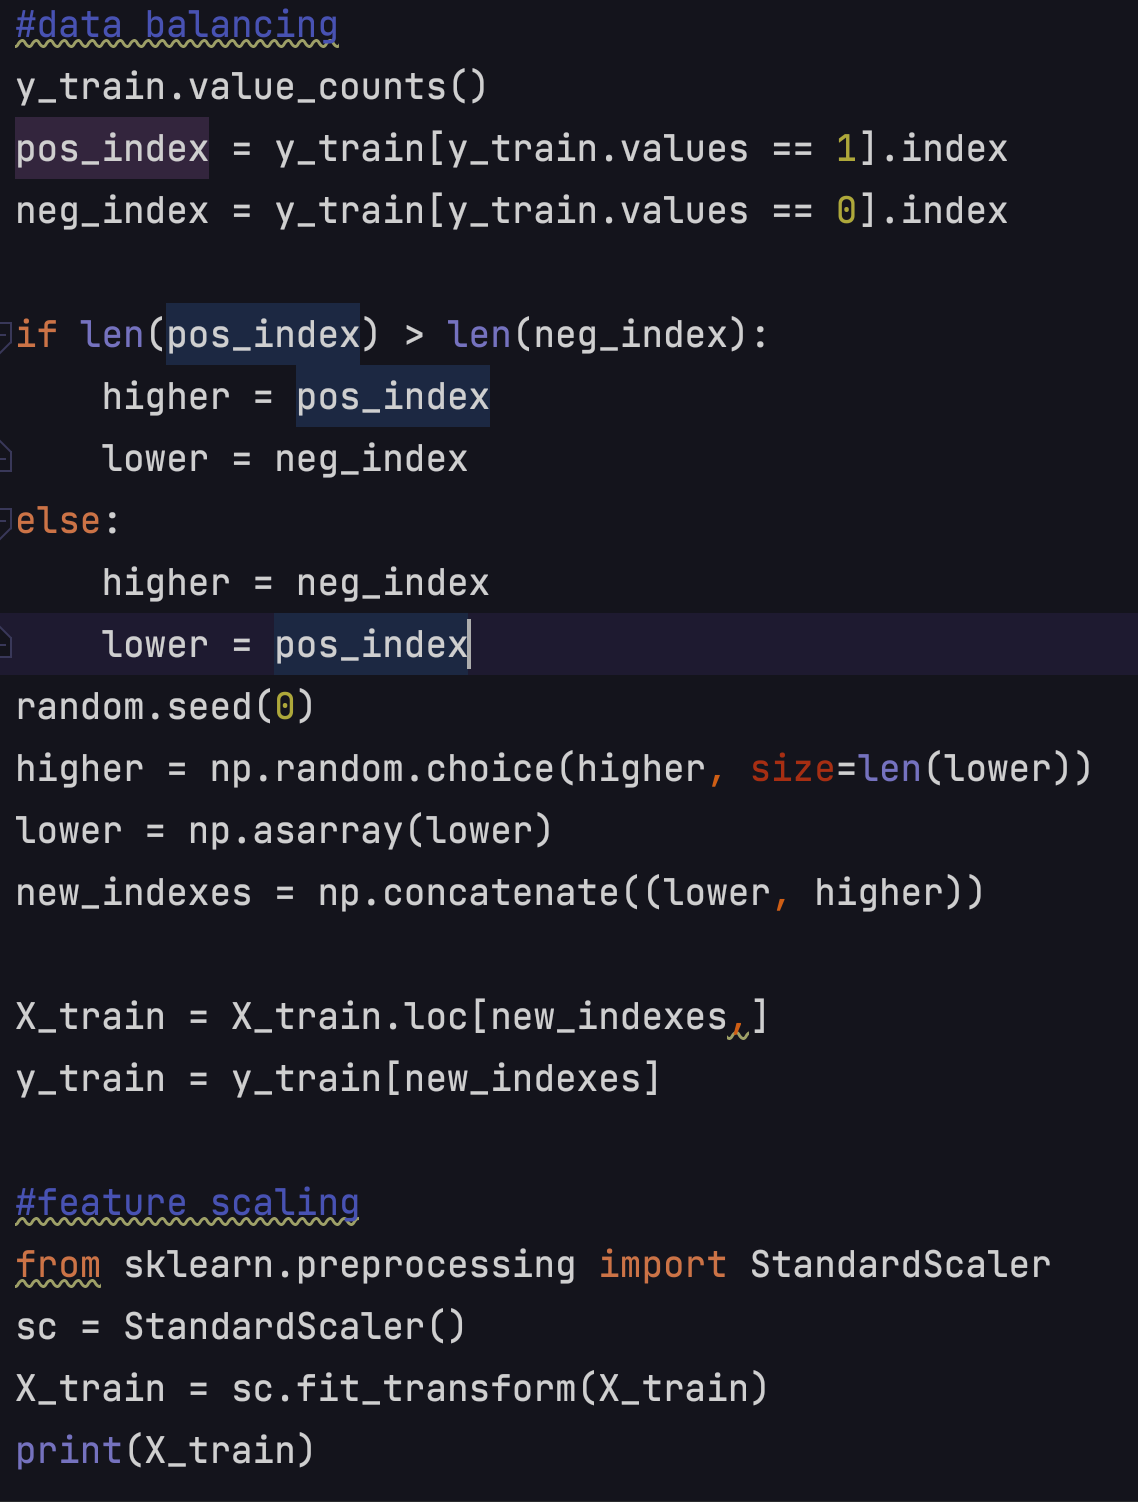
Data balancing, feature scaling and model selection
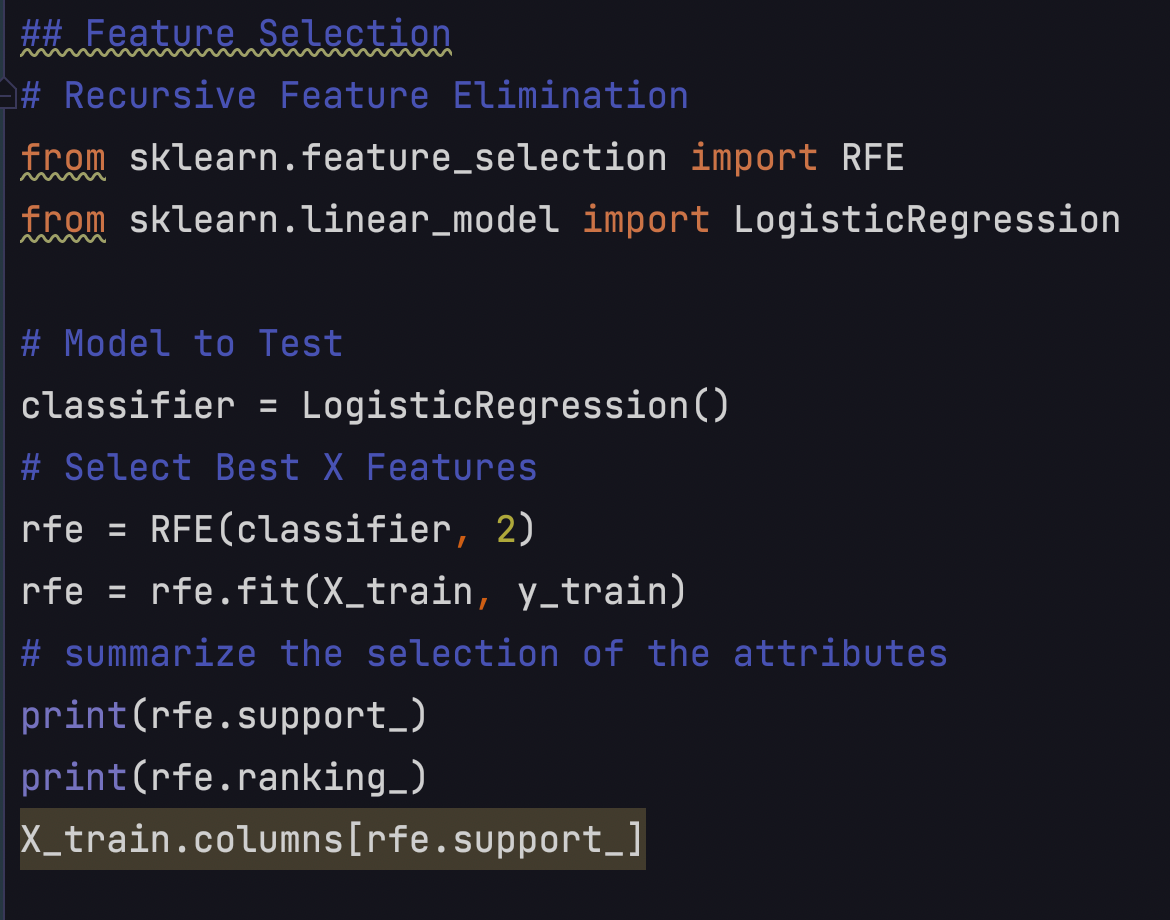
In this dataset, I got more than 40 features, so I decided to narrow down the features to 20.
Data balancing and feature scaling are very important as well.
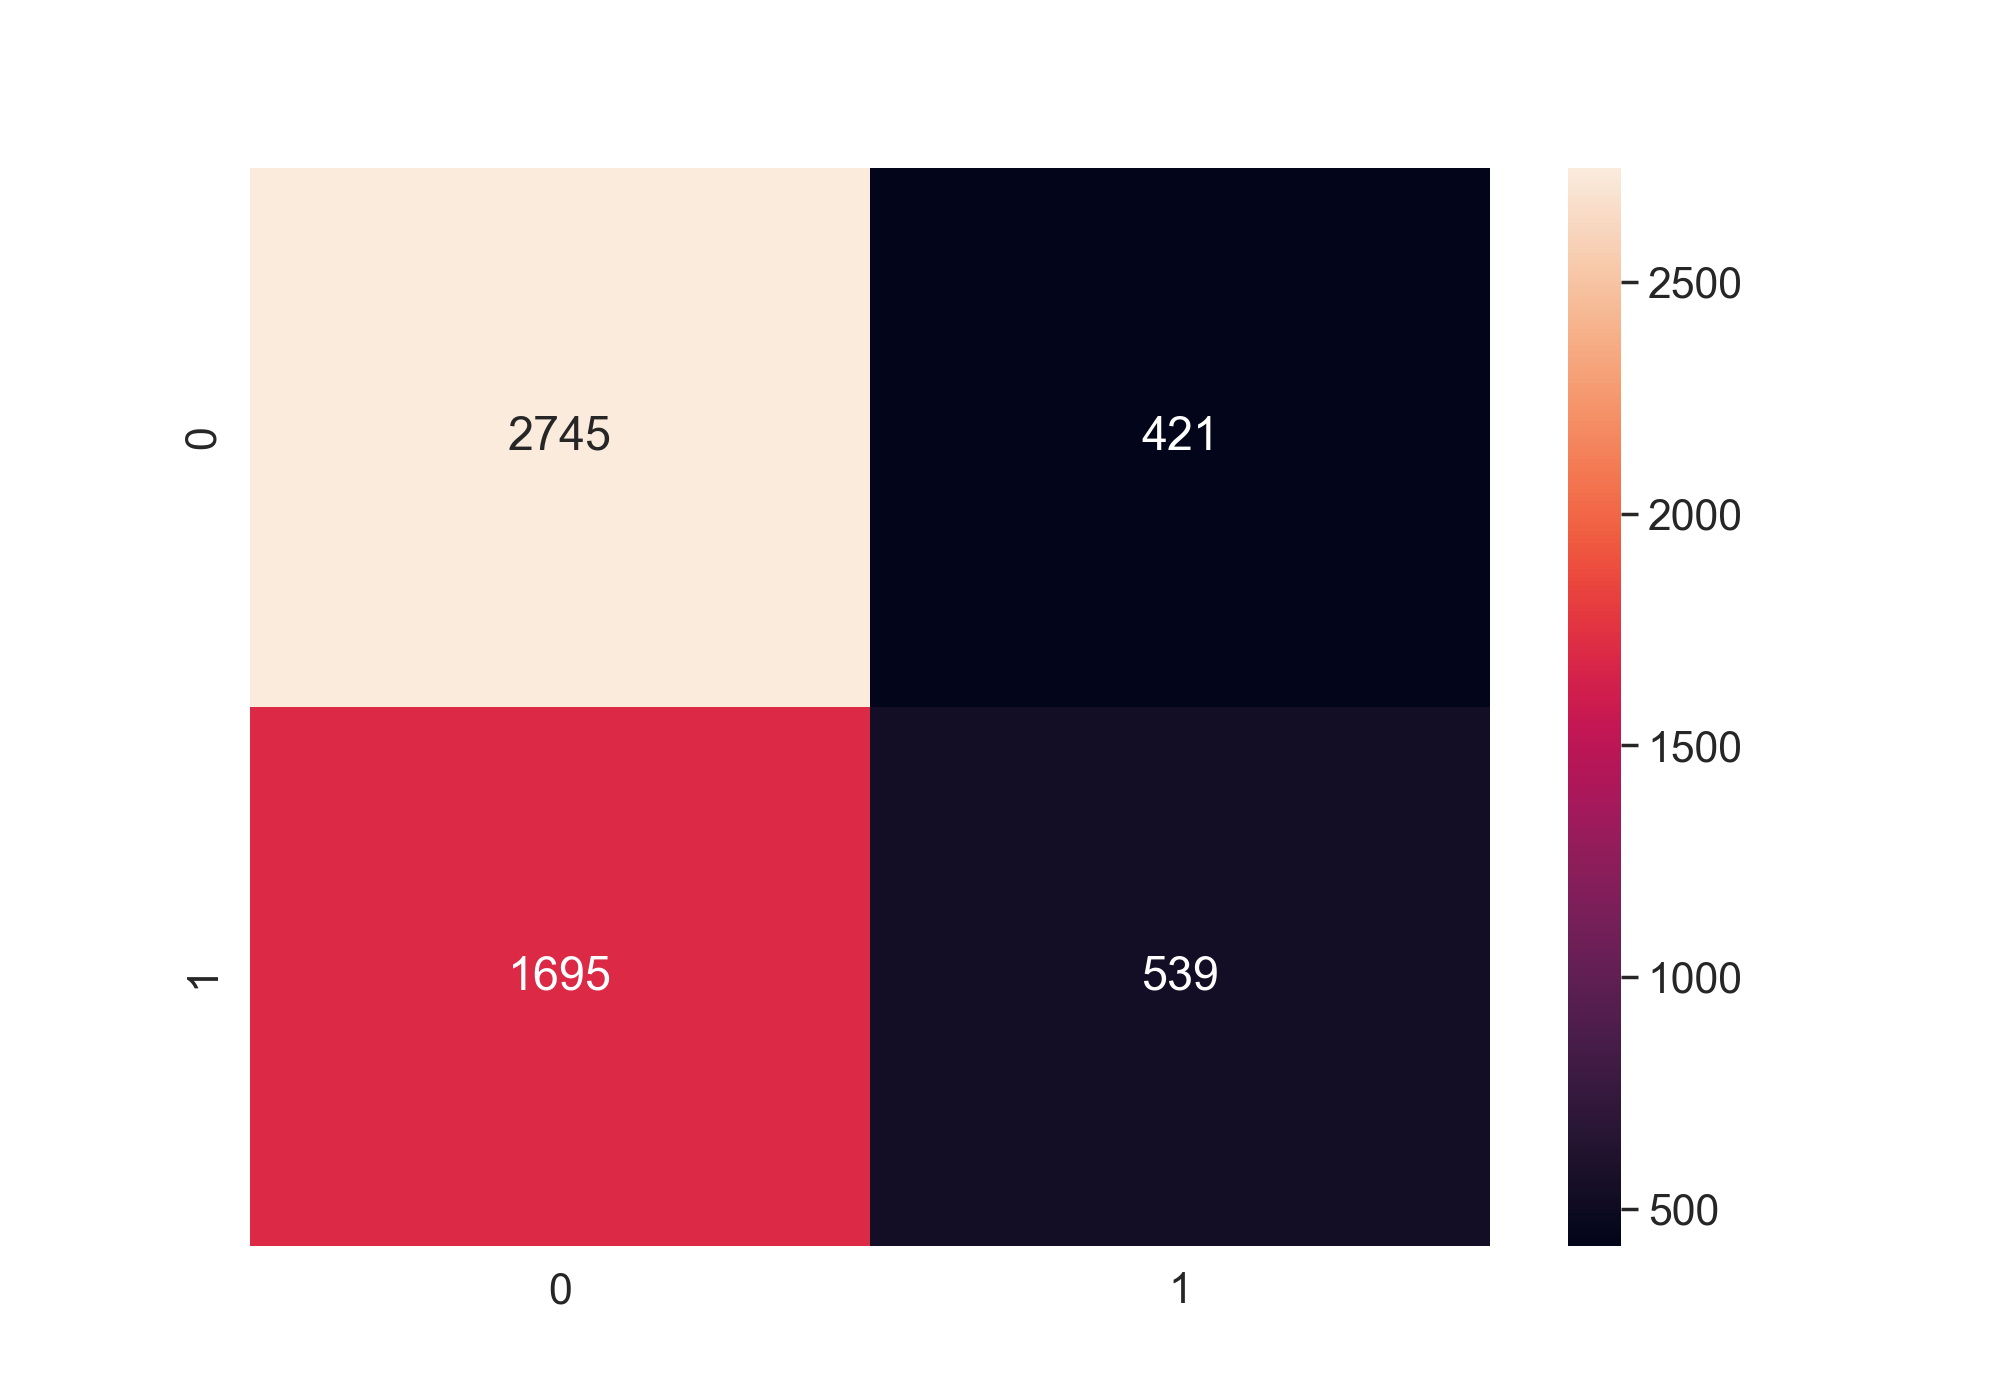
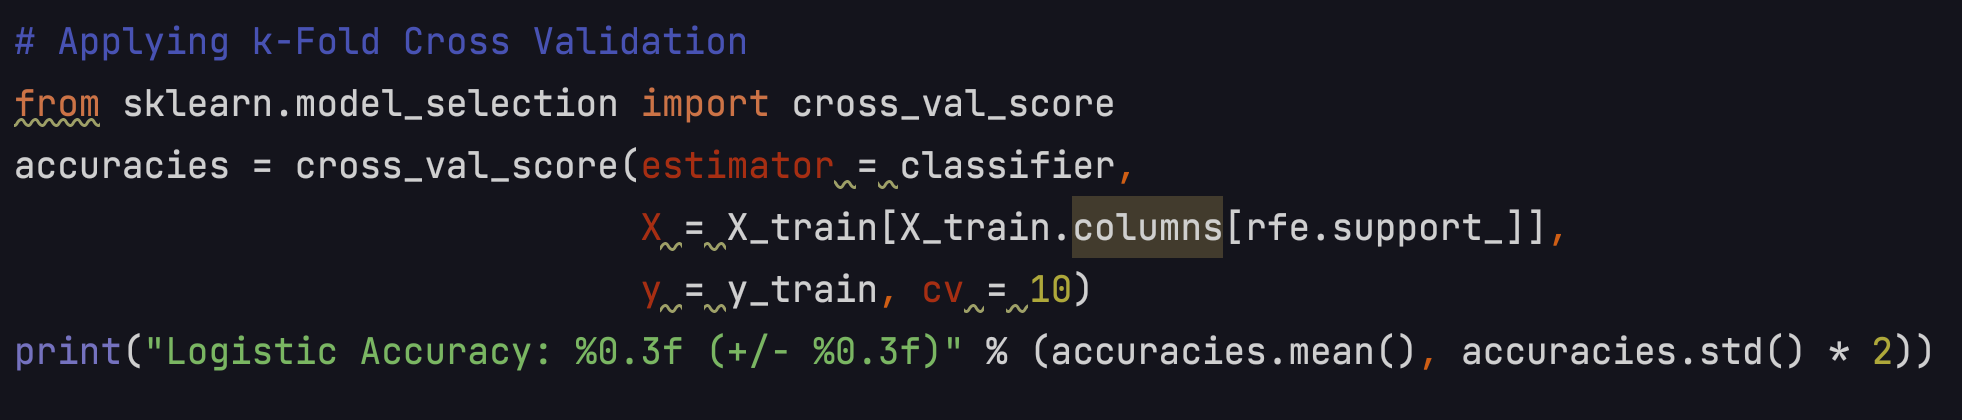
Models
Choosing a regression model, I could interpret the coefficients and provide some
managerial suggestions. Then I use k-fold cross-validation to test my model. The accuracy is 0.643 (+/- 0.009)
Last Thoughts
The main purpose of this project is to help the company improve app features, rather than
predict the churn. If I had had to predict the churn, I'd add tenure in my model.
Adding a time factor could increase the model accuracy significantly.
Software used: Python
Packages used: Sklearn,Seaborn