
I used to use Tableau during the data exploitation and reporting stages until I started using AWS QuickSight.
AWS QuickSight is composed of Quick and Sight. After using it, I feel QuickSight is too quick and too insightful.
Due to my Tableau background, I found out that QuickSight is very similar to Tableau and it also has some features that
Tableau doesn't have. In this project, I'll show you my experience of using AWS QuickSight.
Data
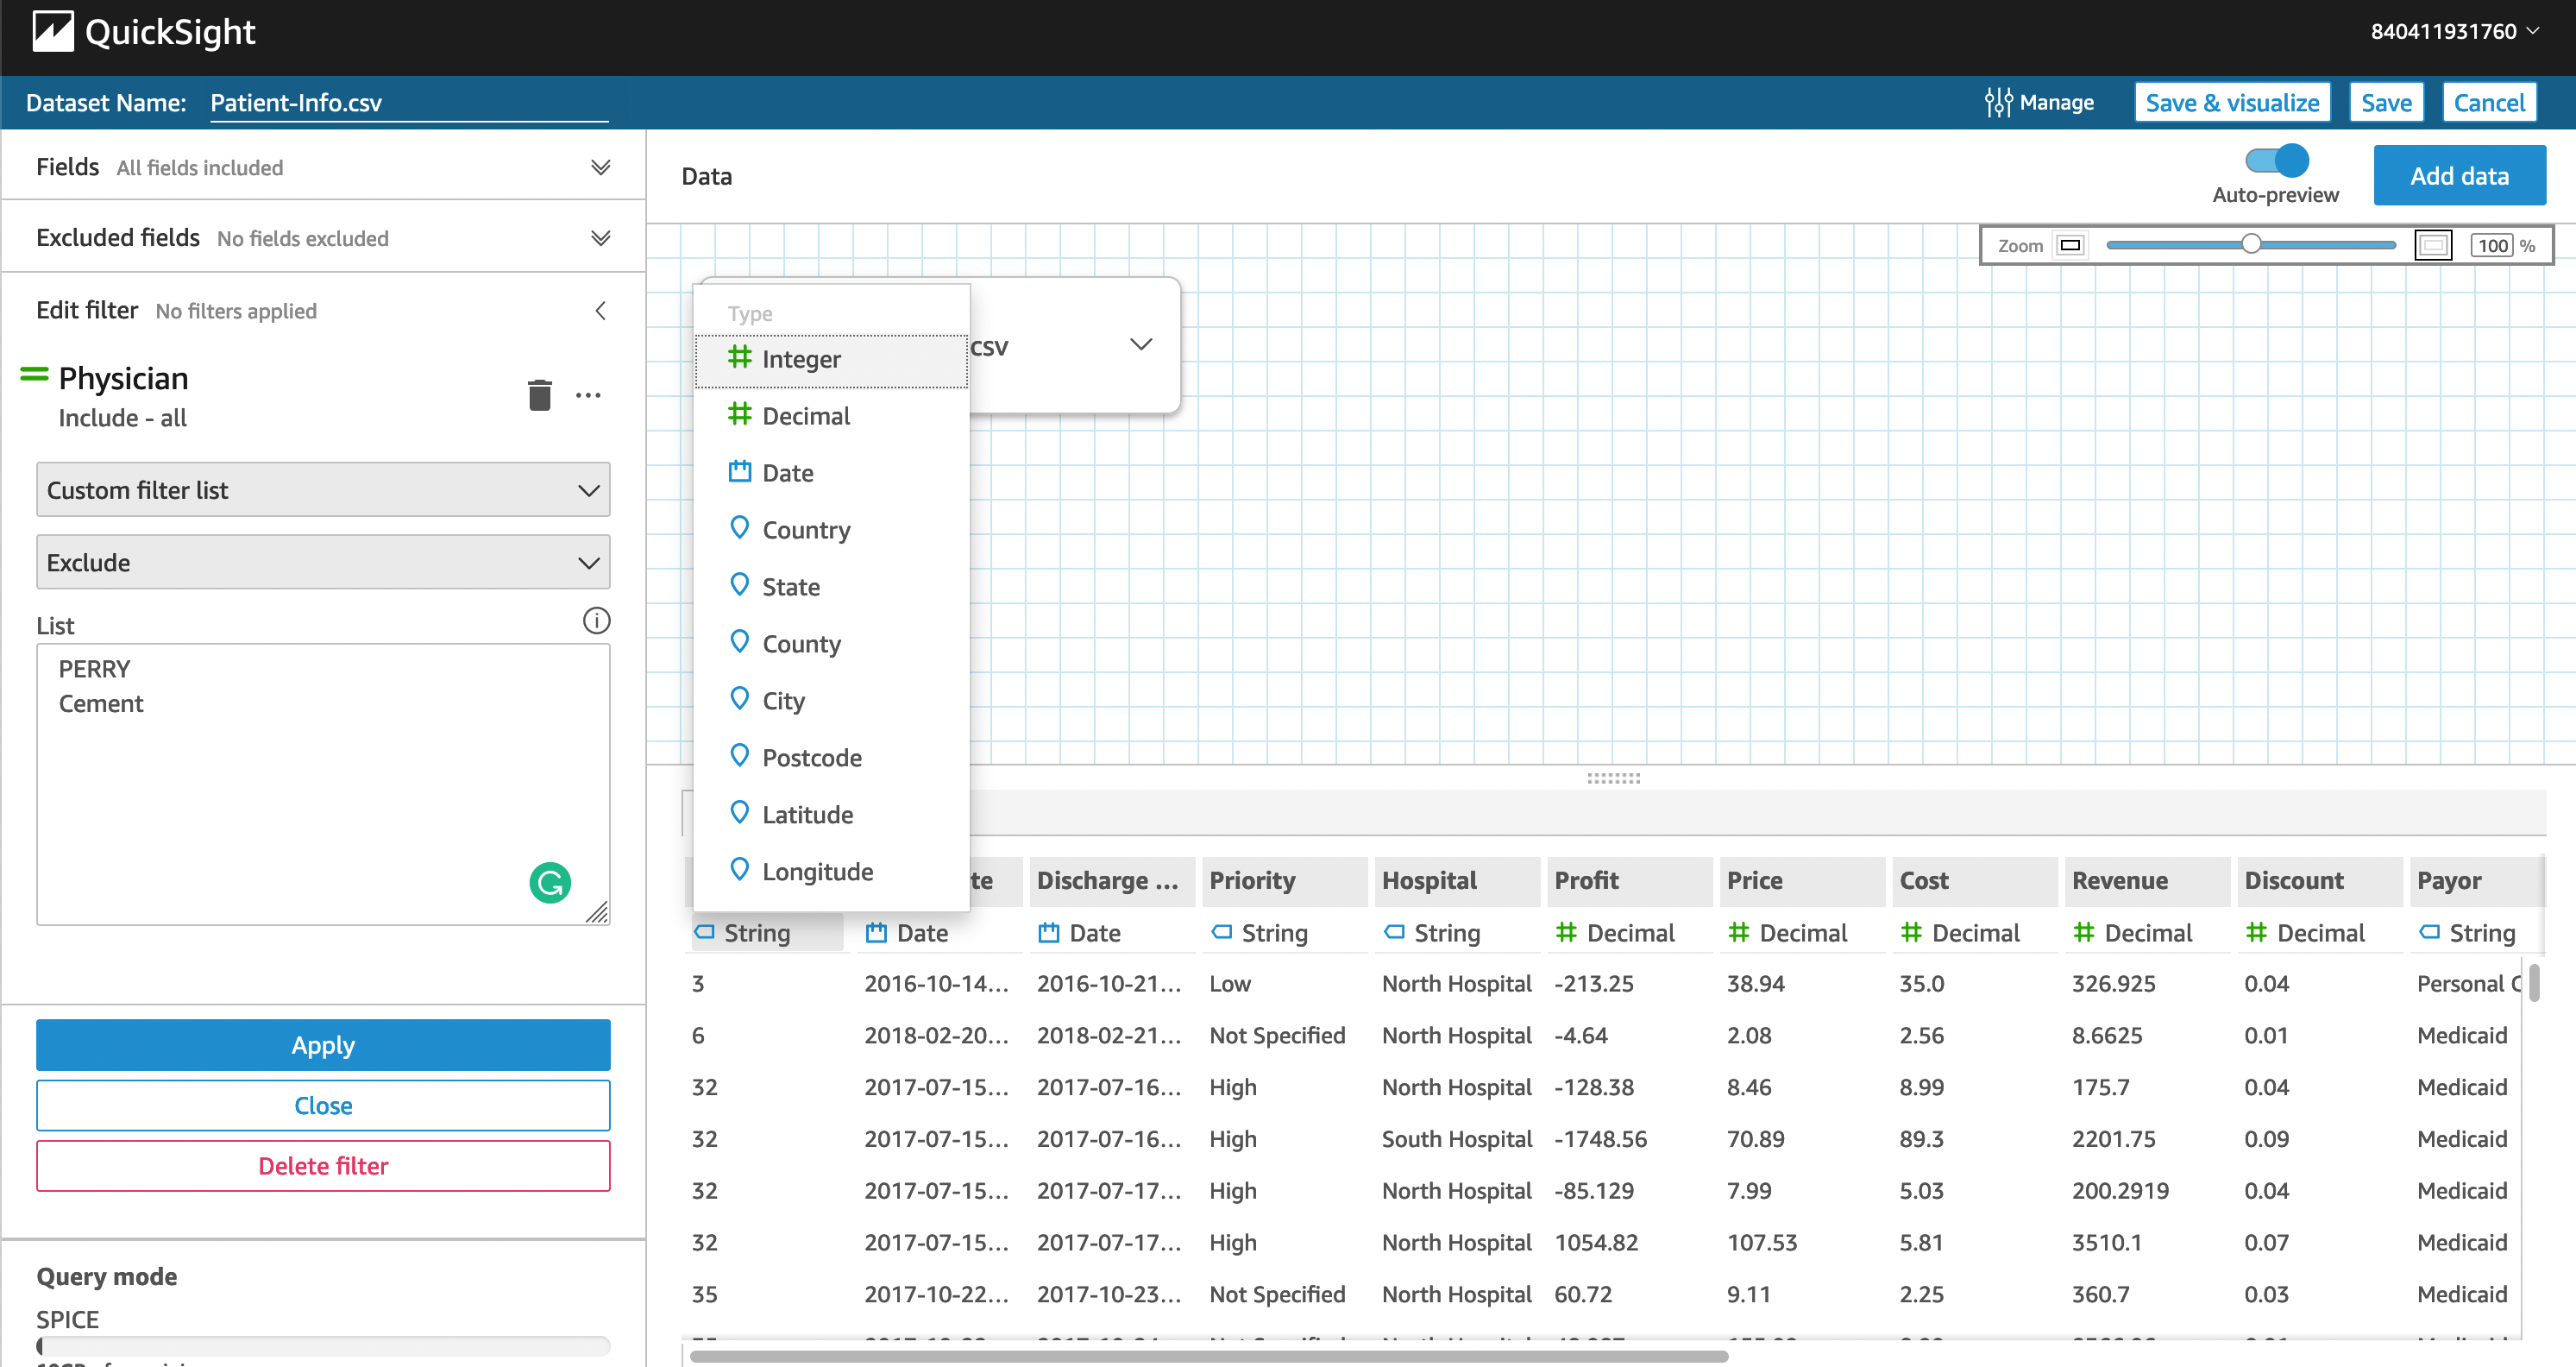
You can edit your data directly in QuickSight, excluding rows, creating calculated fields, and so on.
It's also very easy to change your data type before you start creating your visuals.
Top Contributors
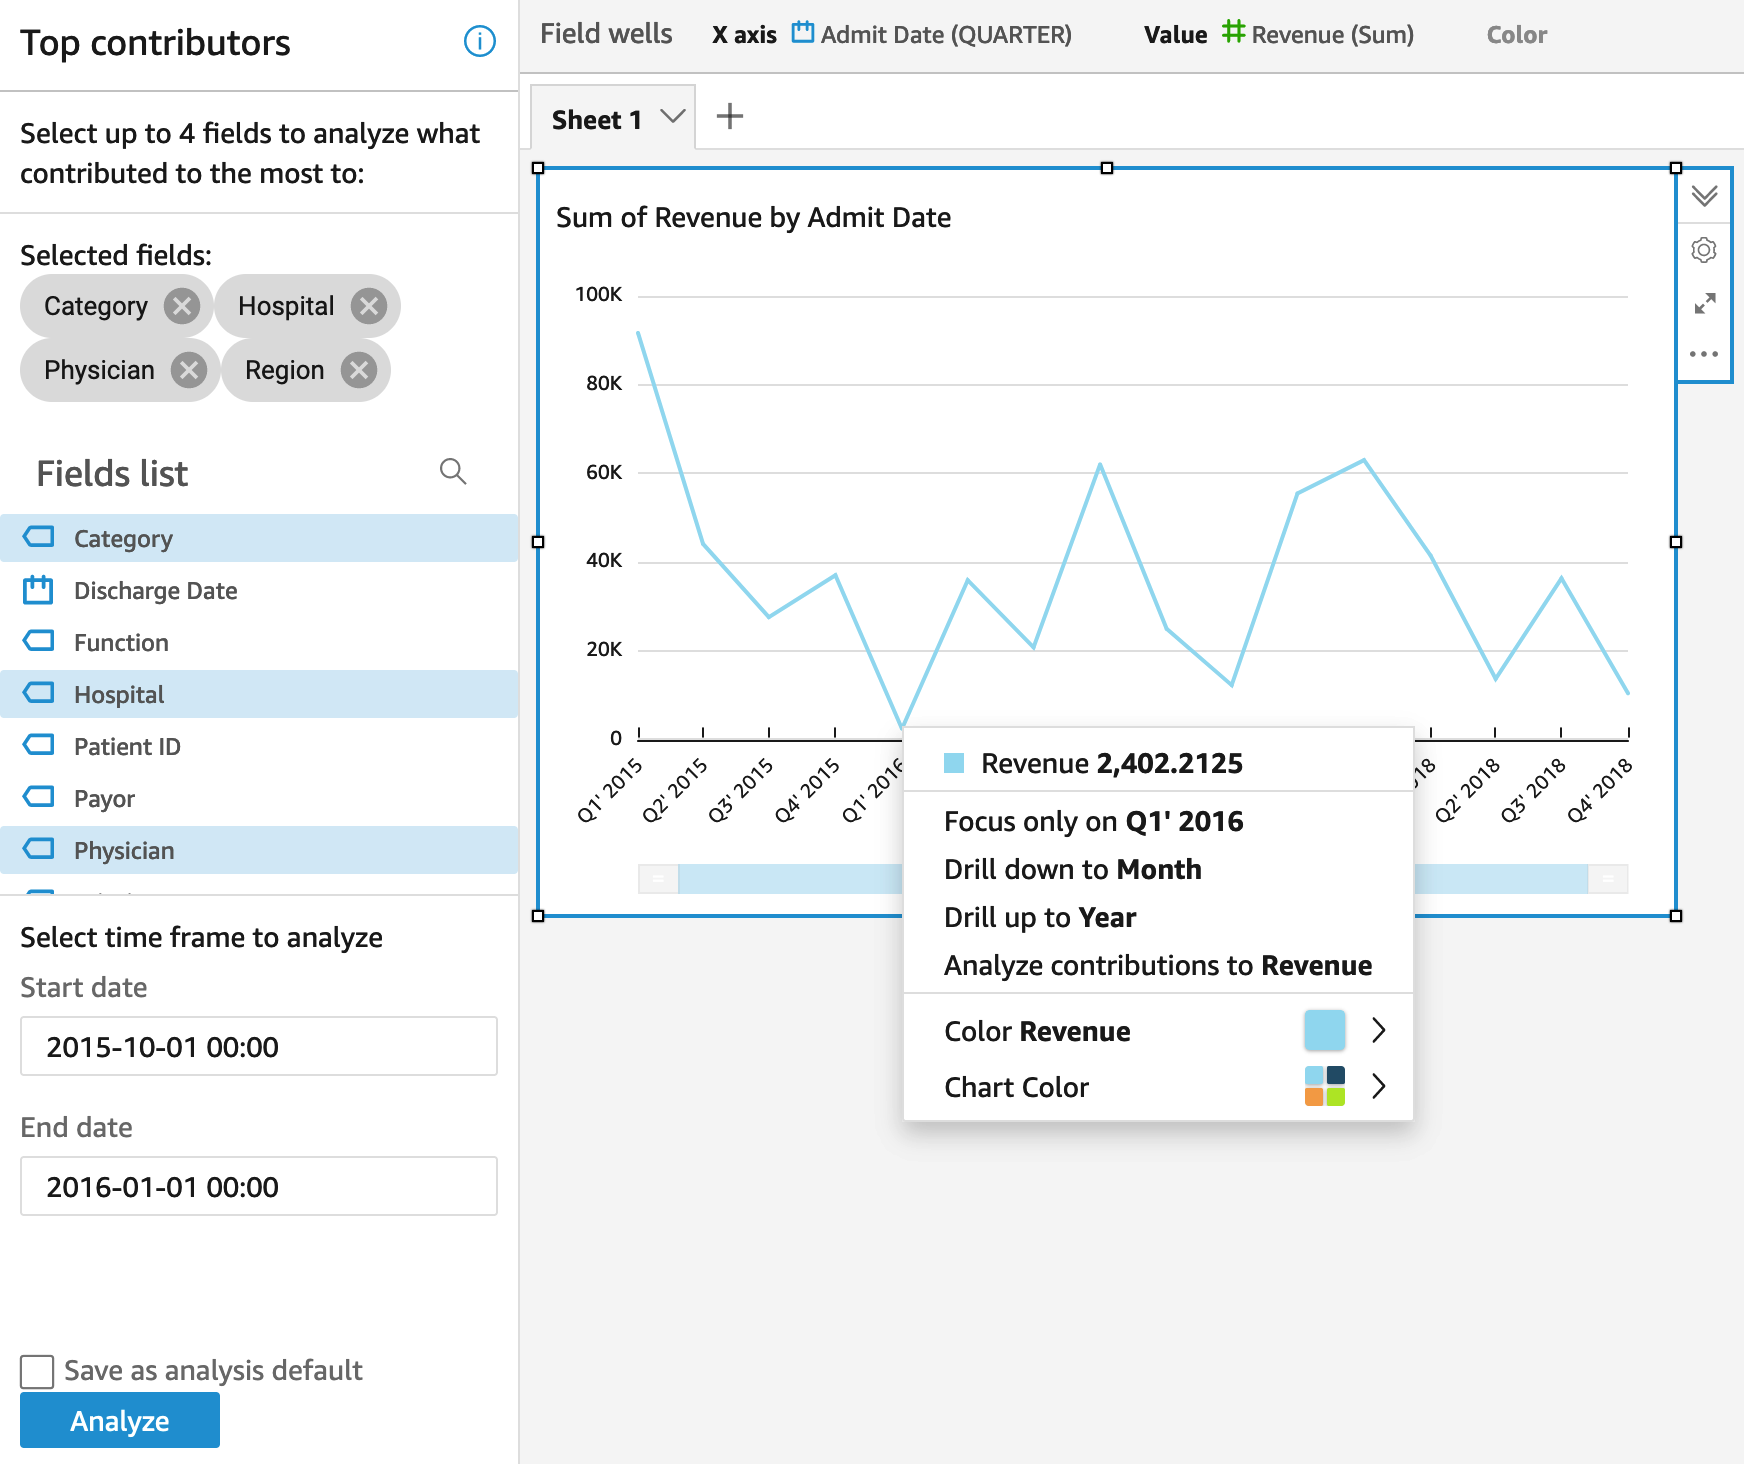
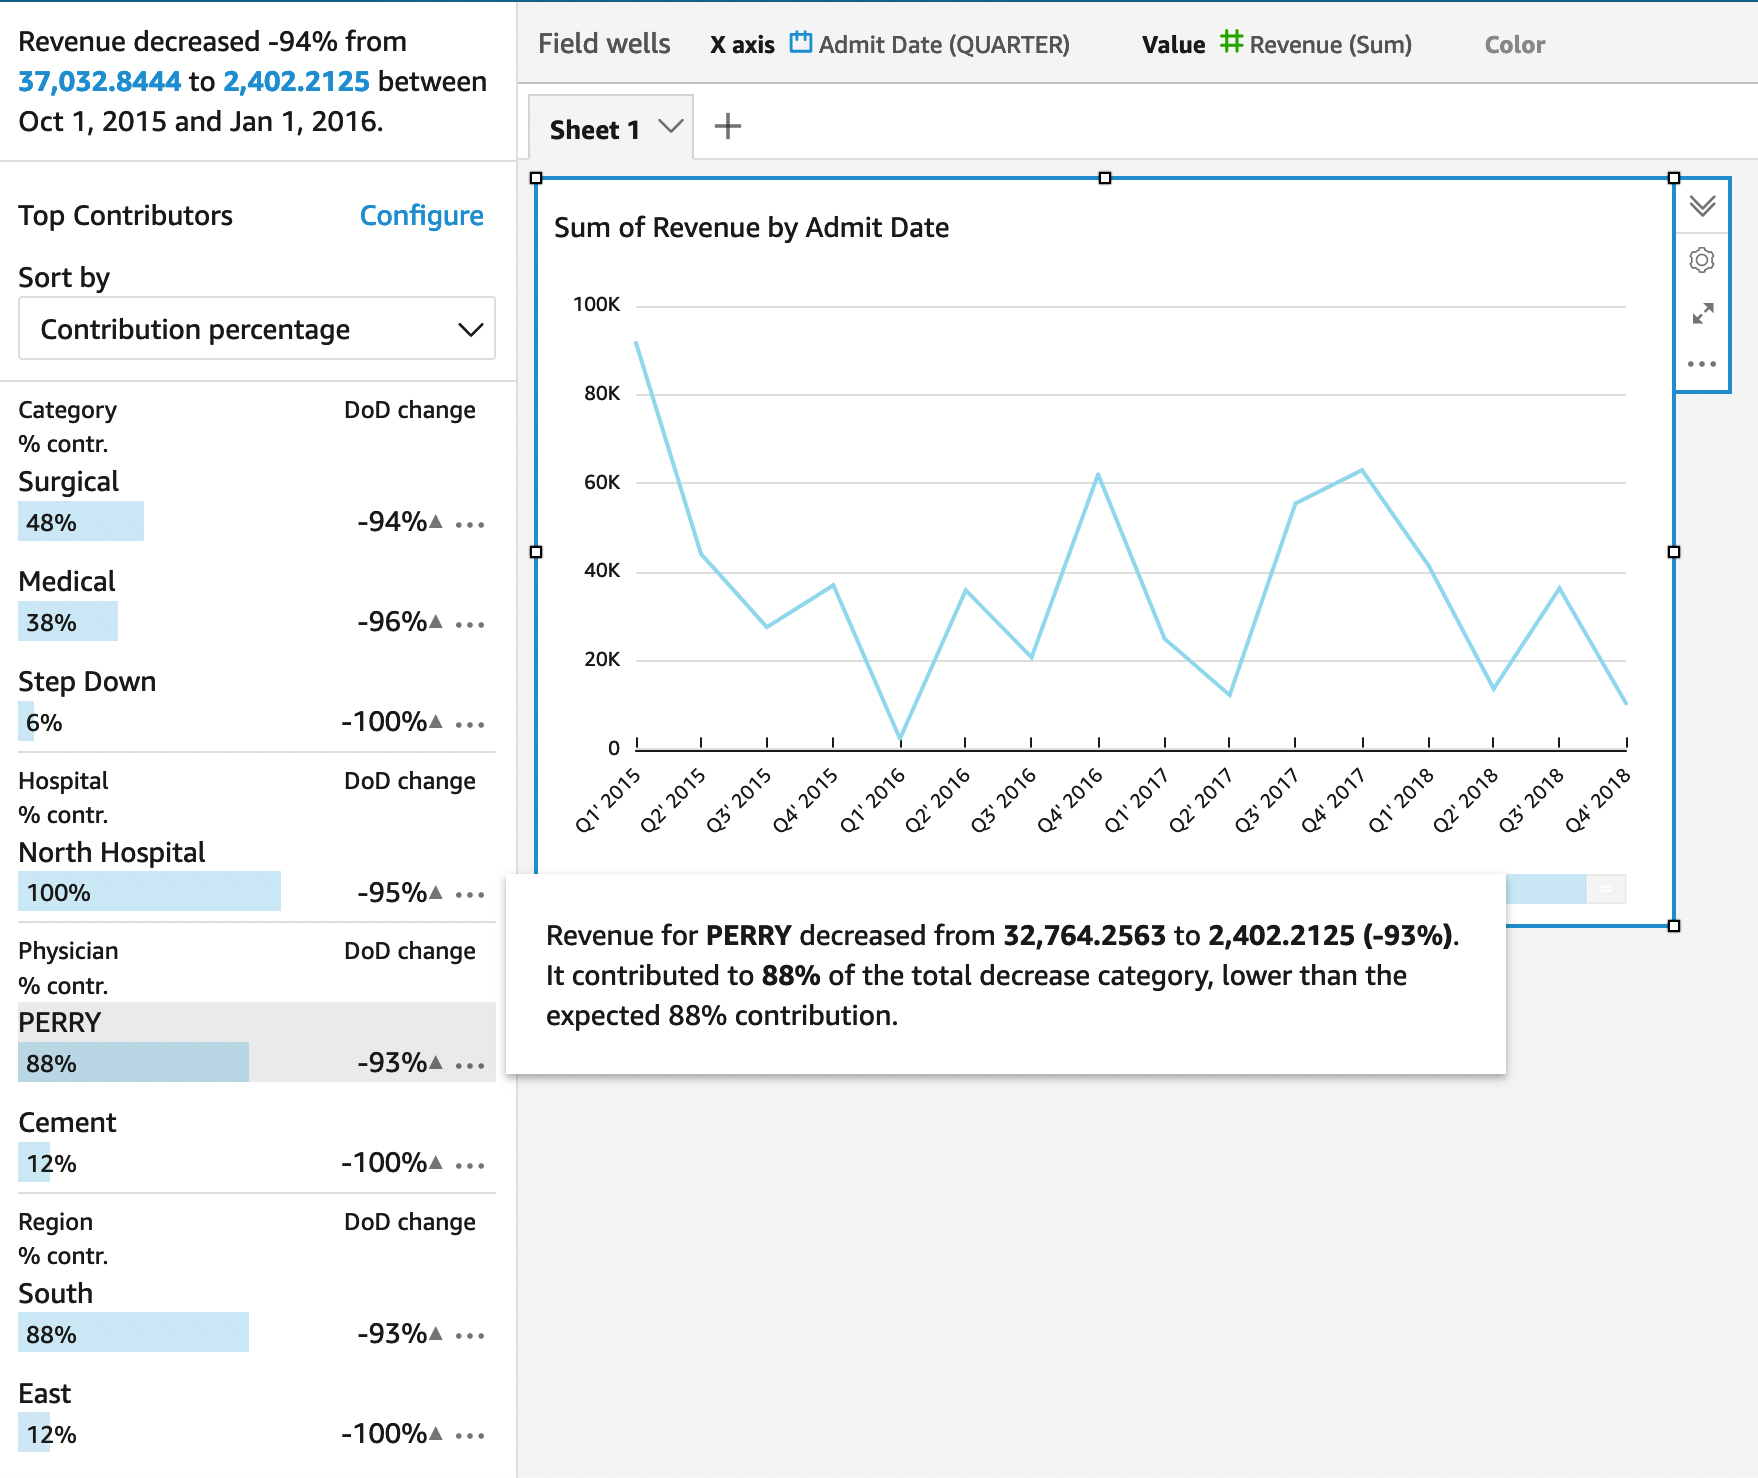
If you find anything unusual, you can choose that point and try to find out the top four contributors to it. For instance,
in my demo dataset, I saw a drastic drop in revenue, so I picked four columns to see how much
they caused this drop.
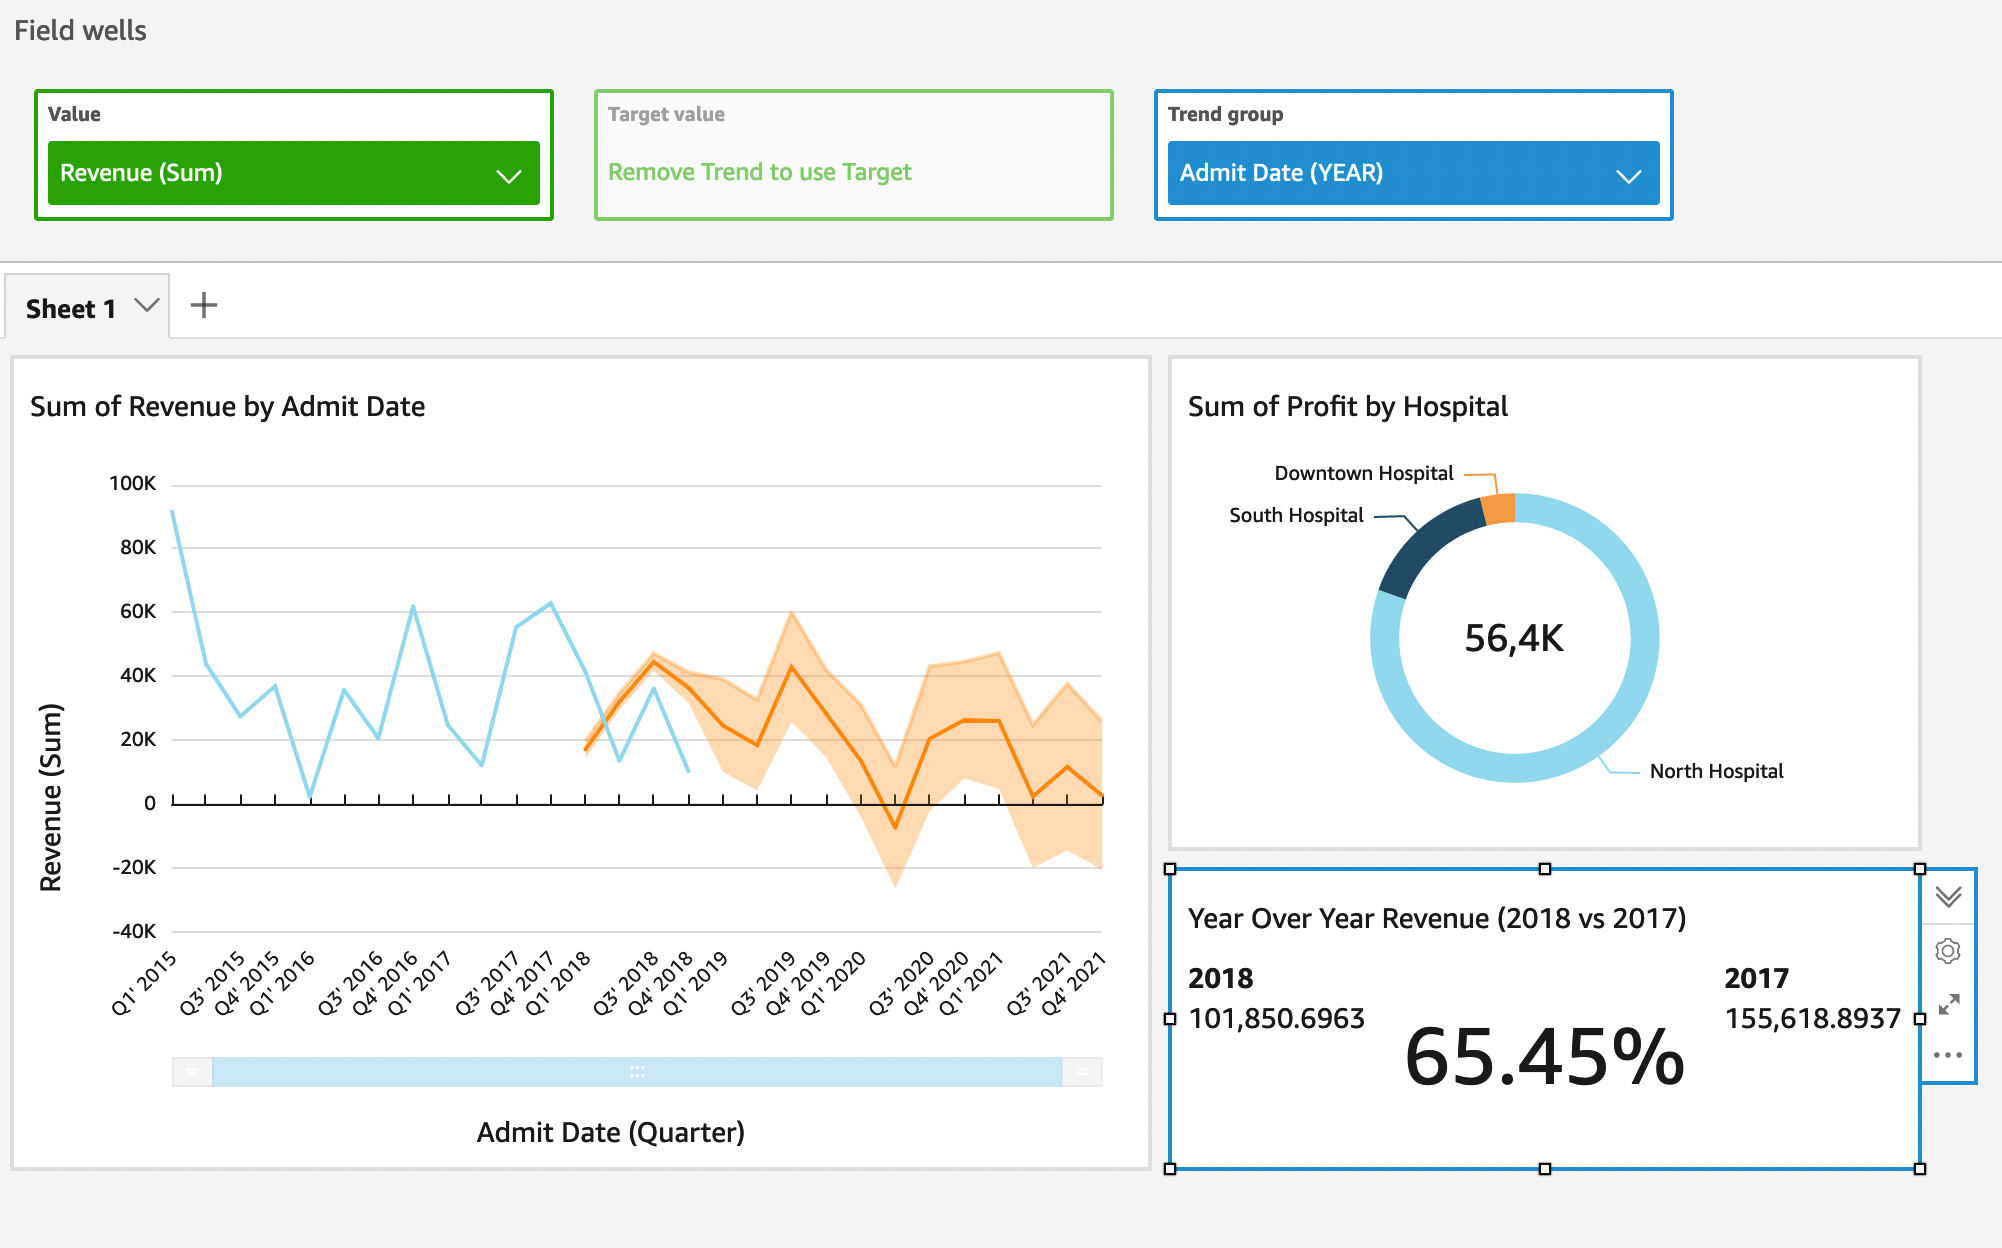
Forecasting
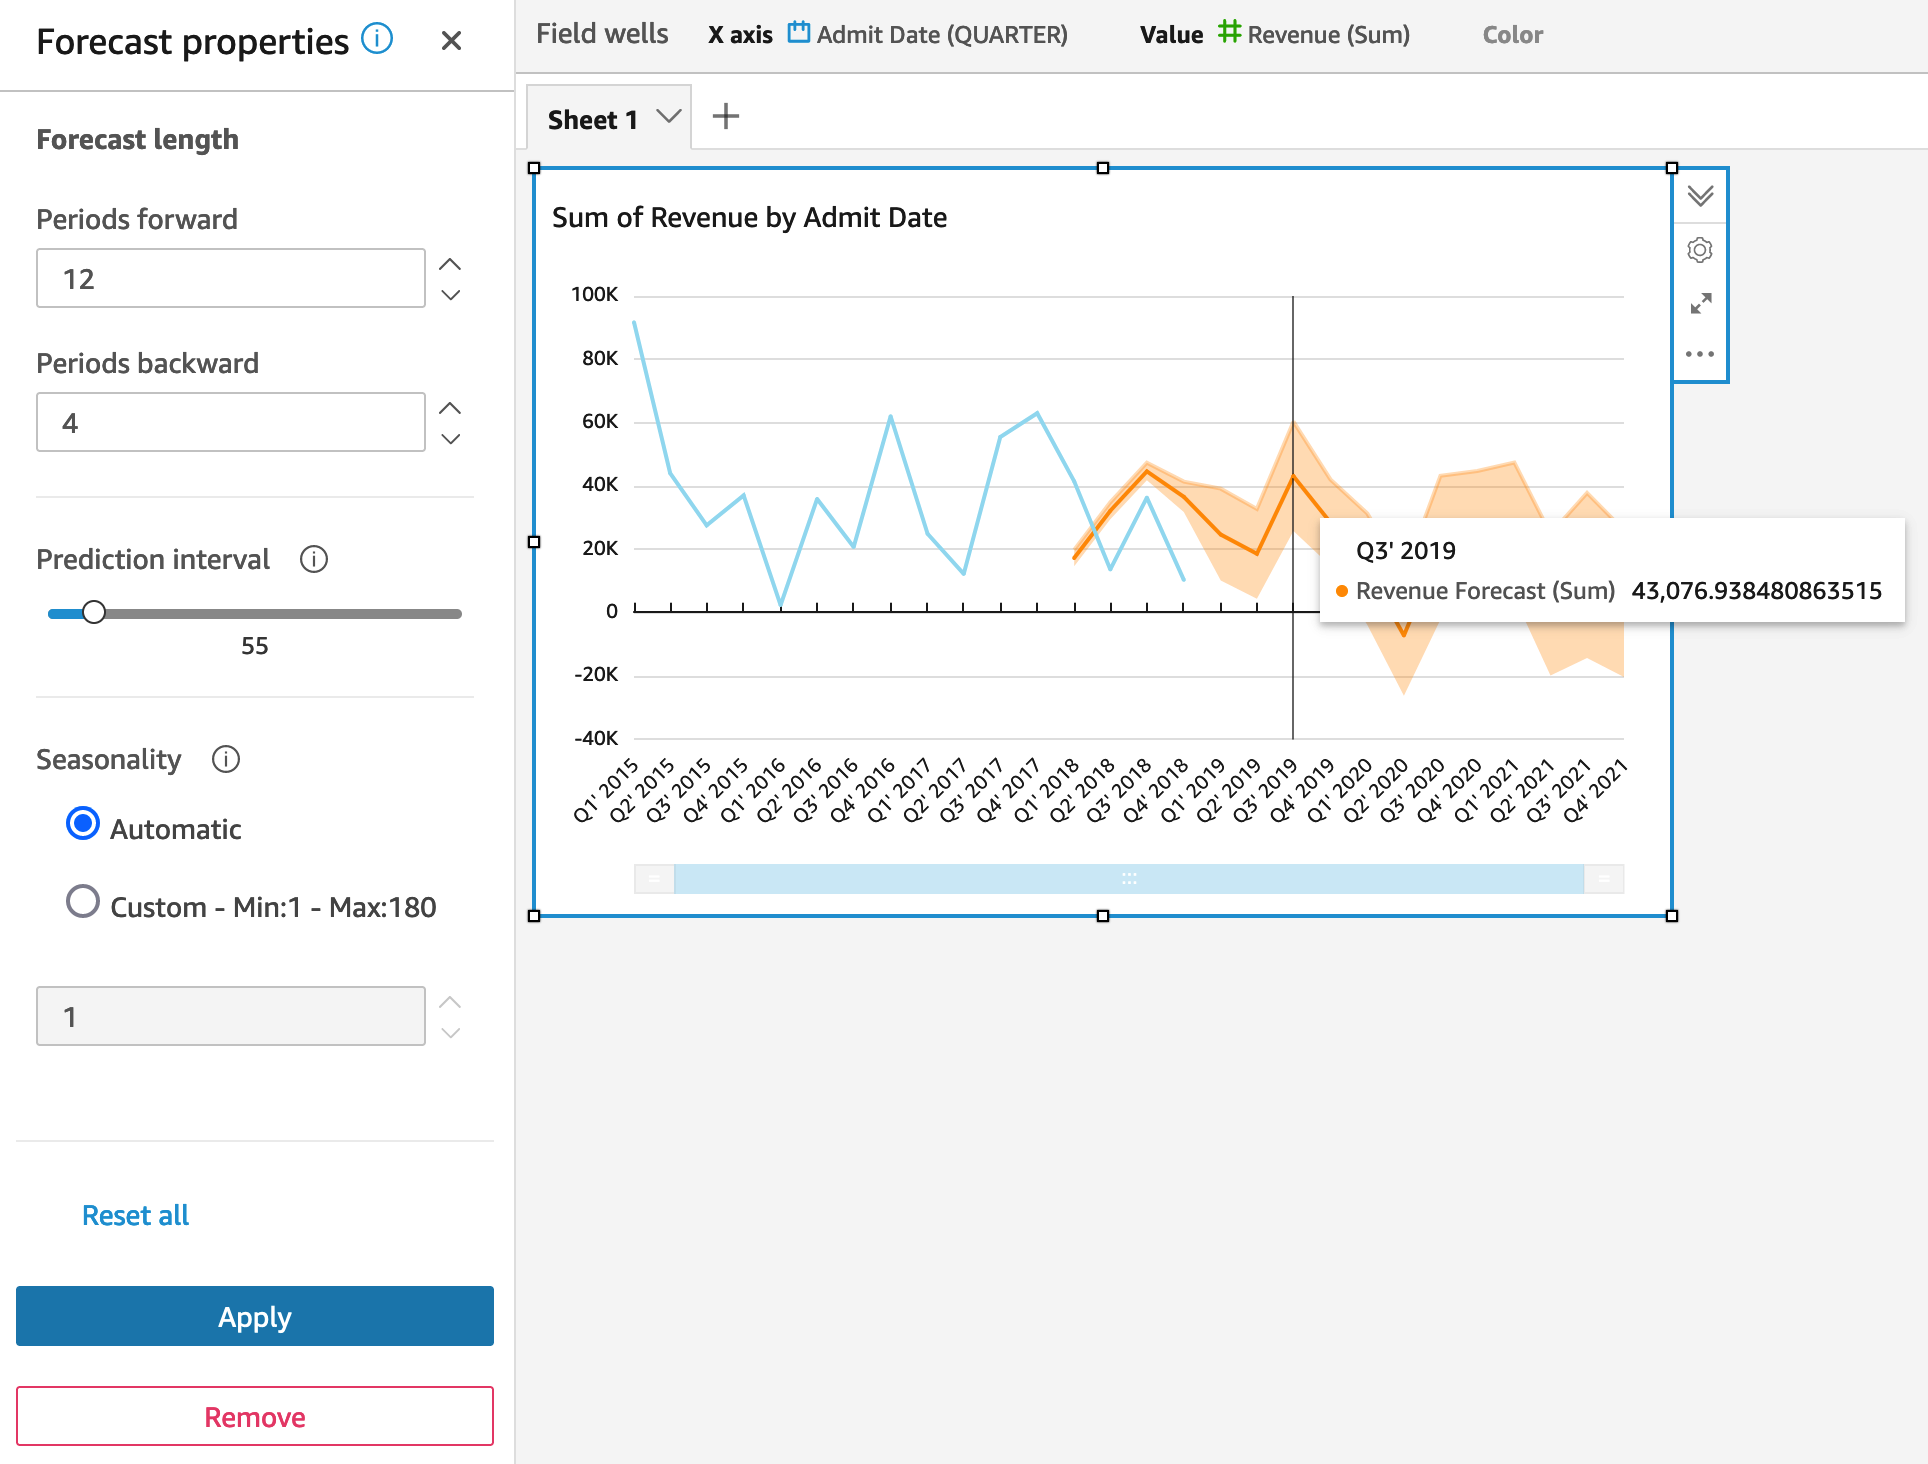
It's very easy to predict your trend in QuickSight. With just a simple click, QuickSight would
generate a future trend by using the random forest algorithm. You can choose your confidence interval
and periods backward.
KPI
Creating a donut chart and KPI is very easy as well.
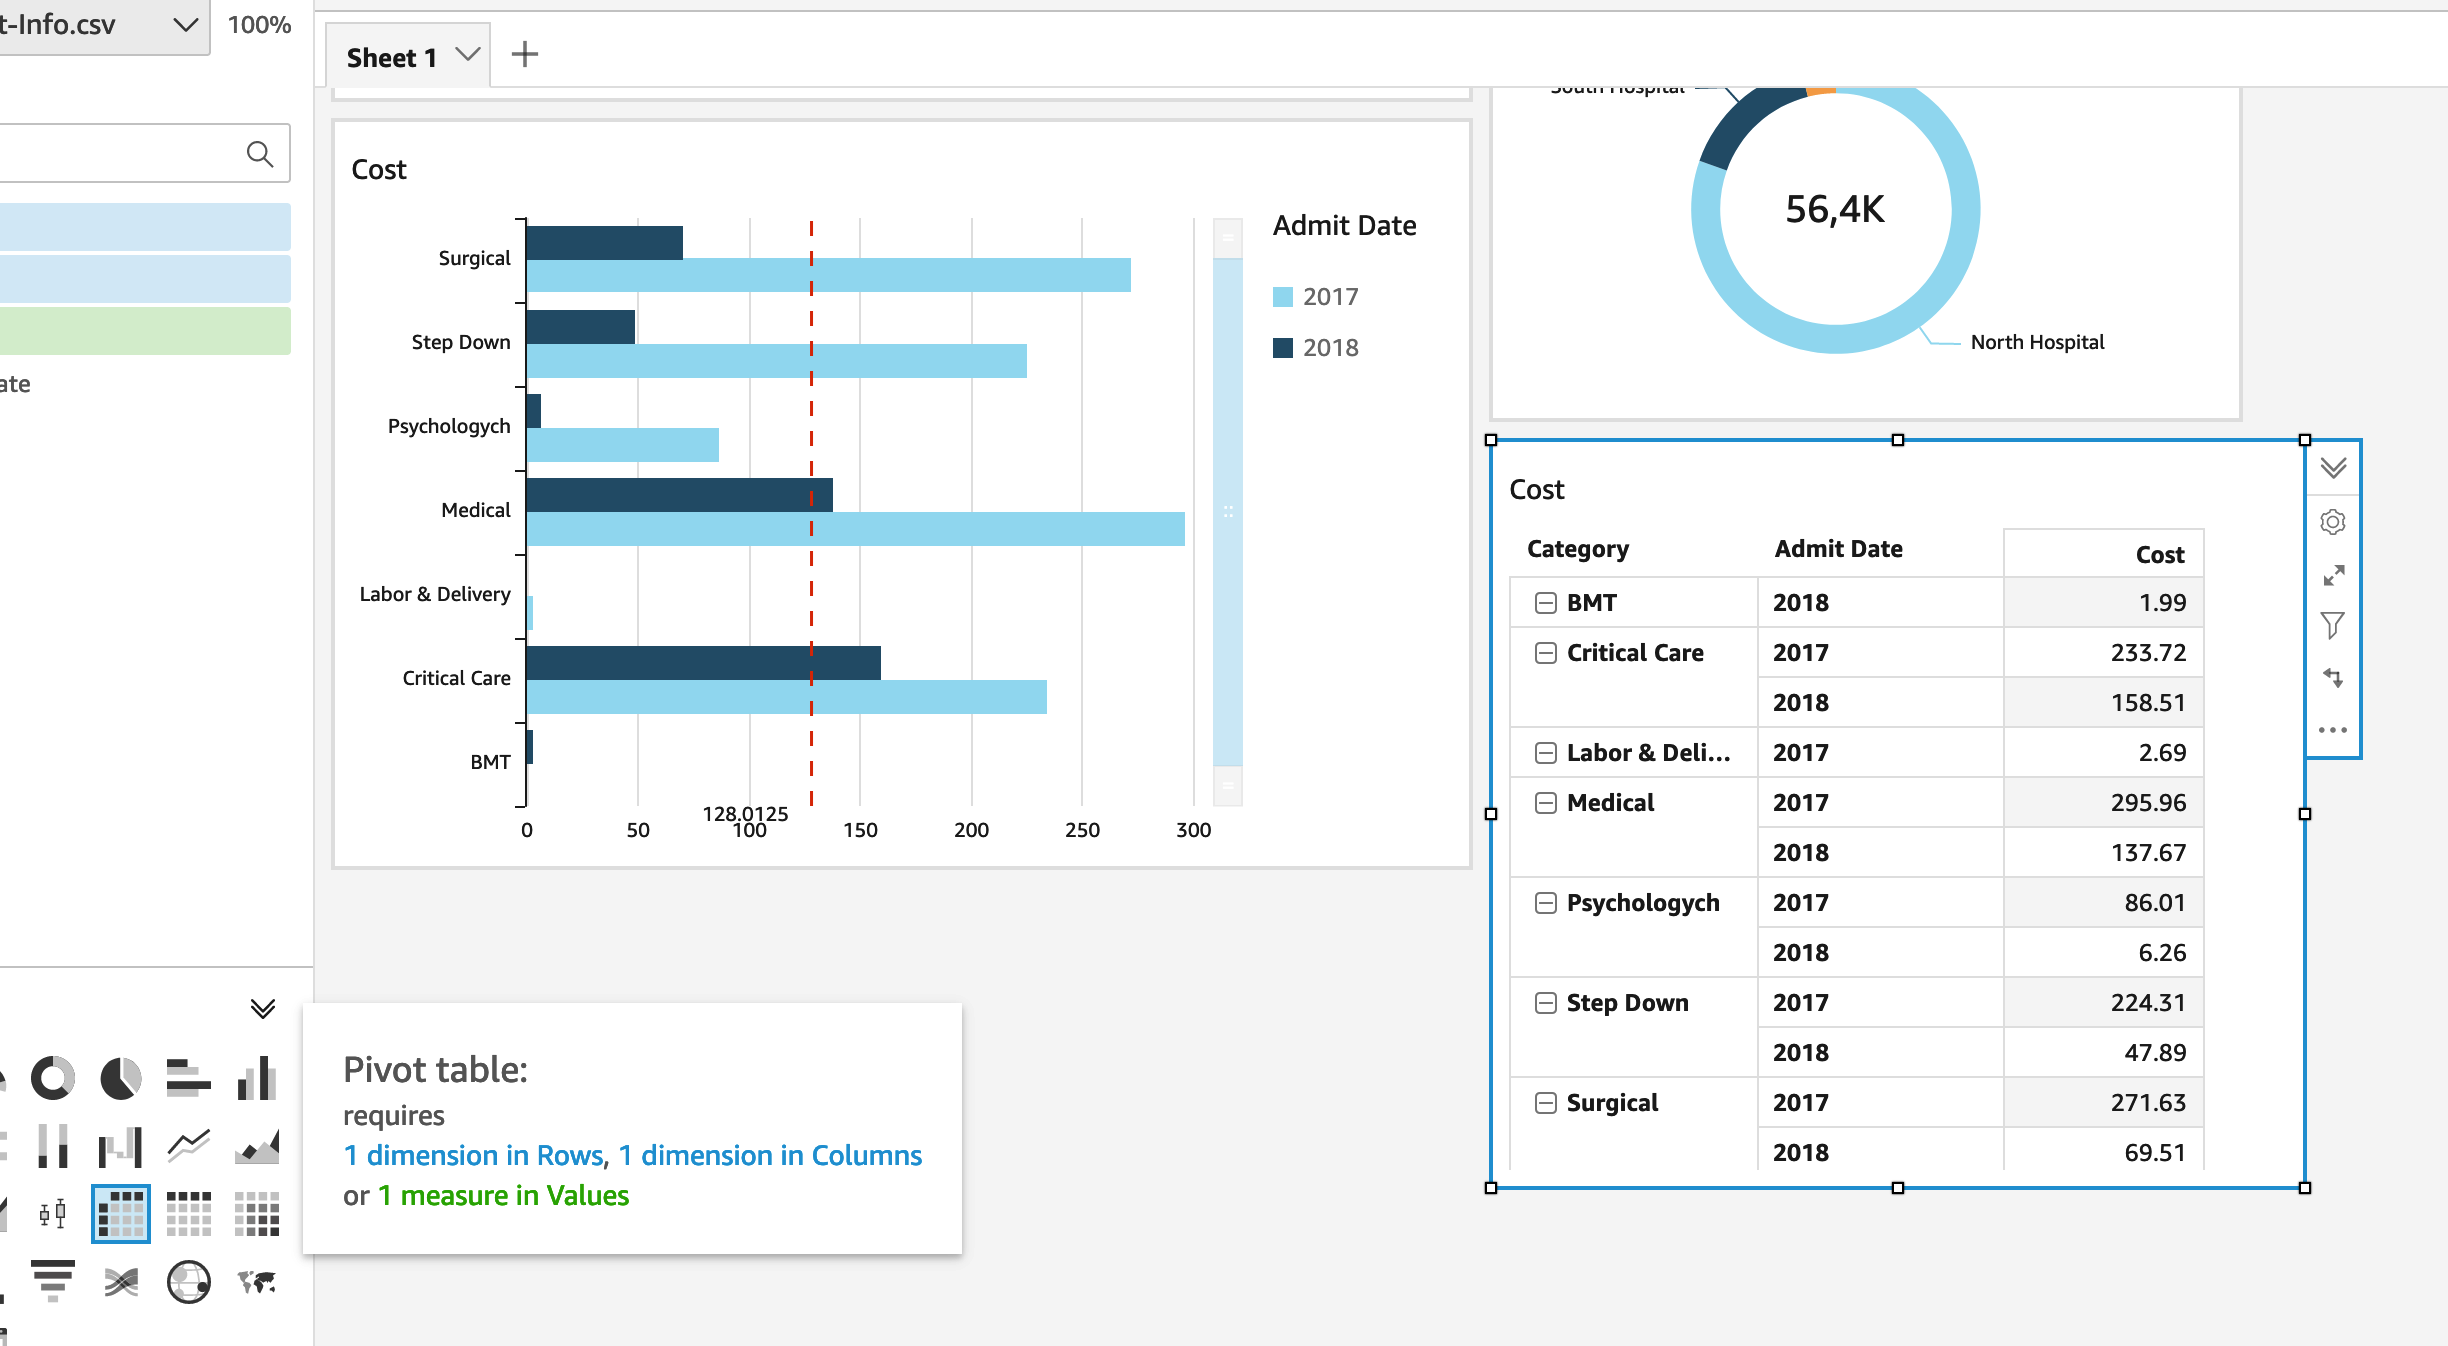
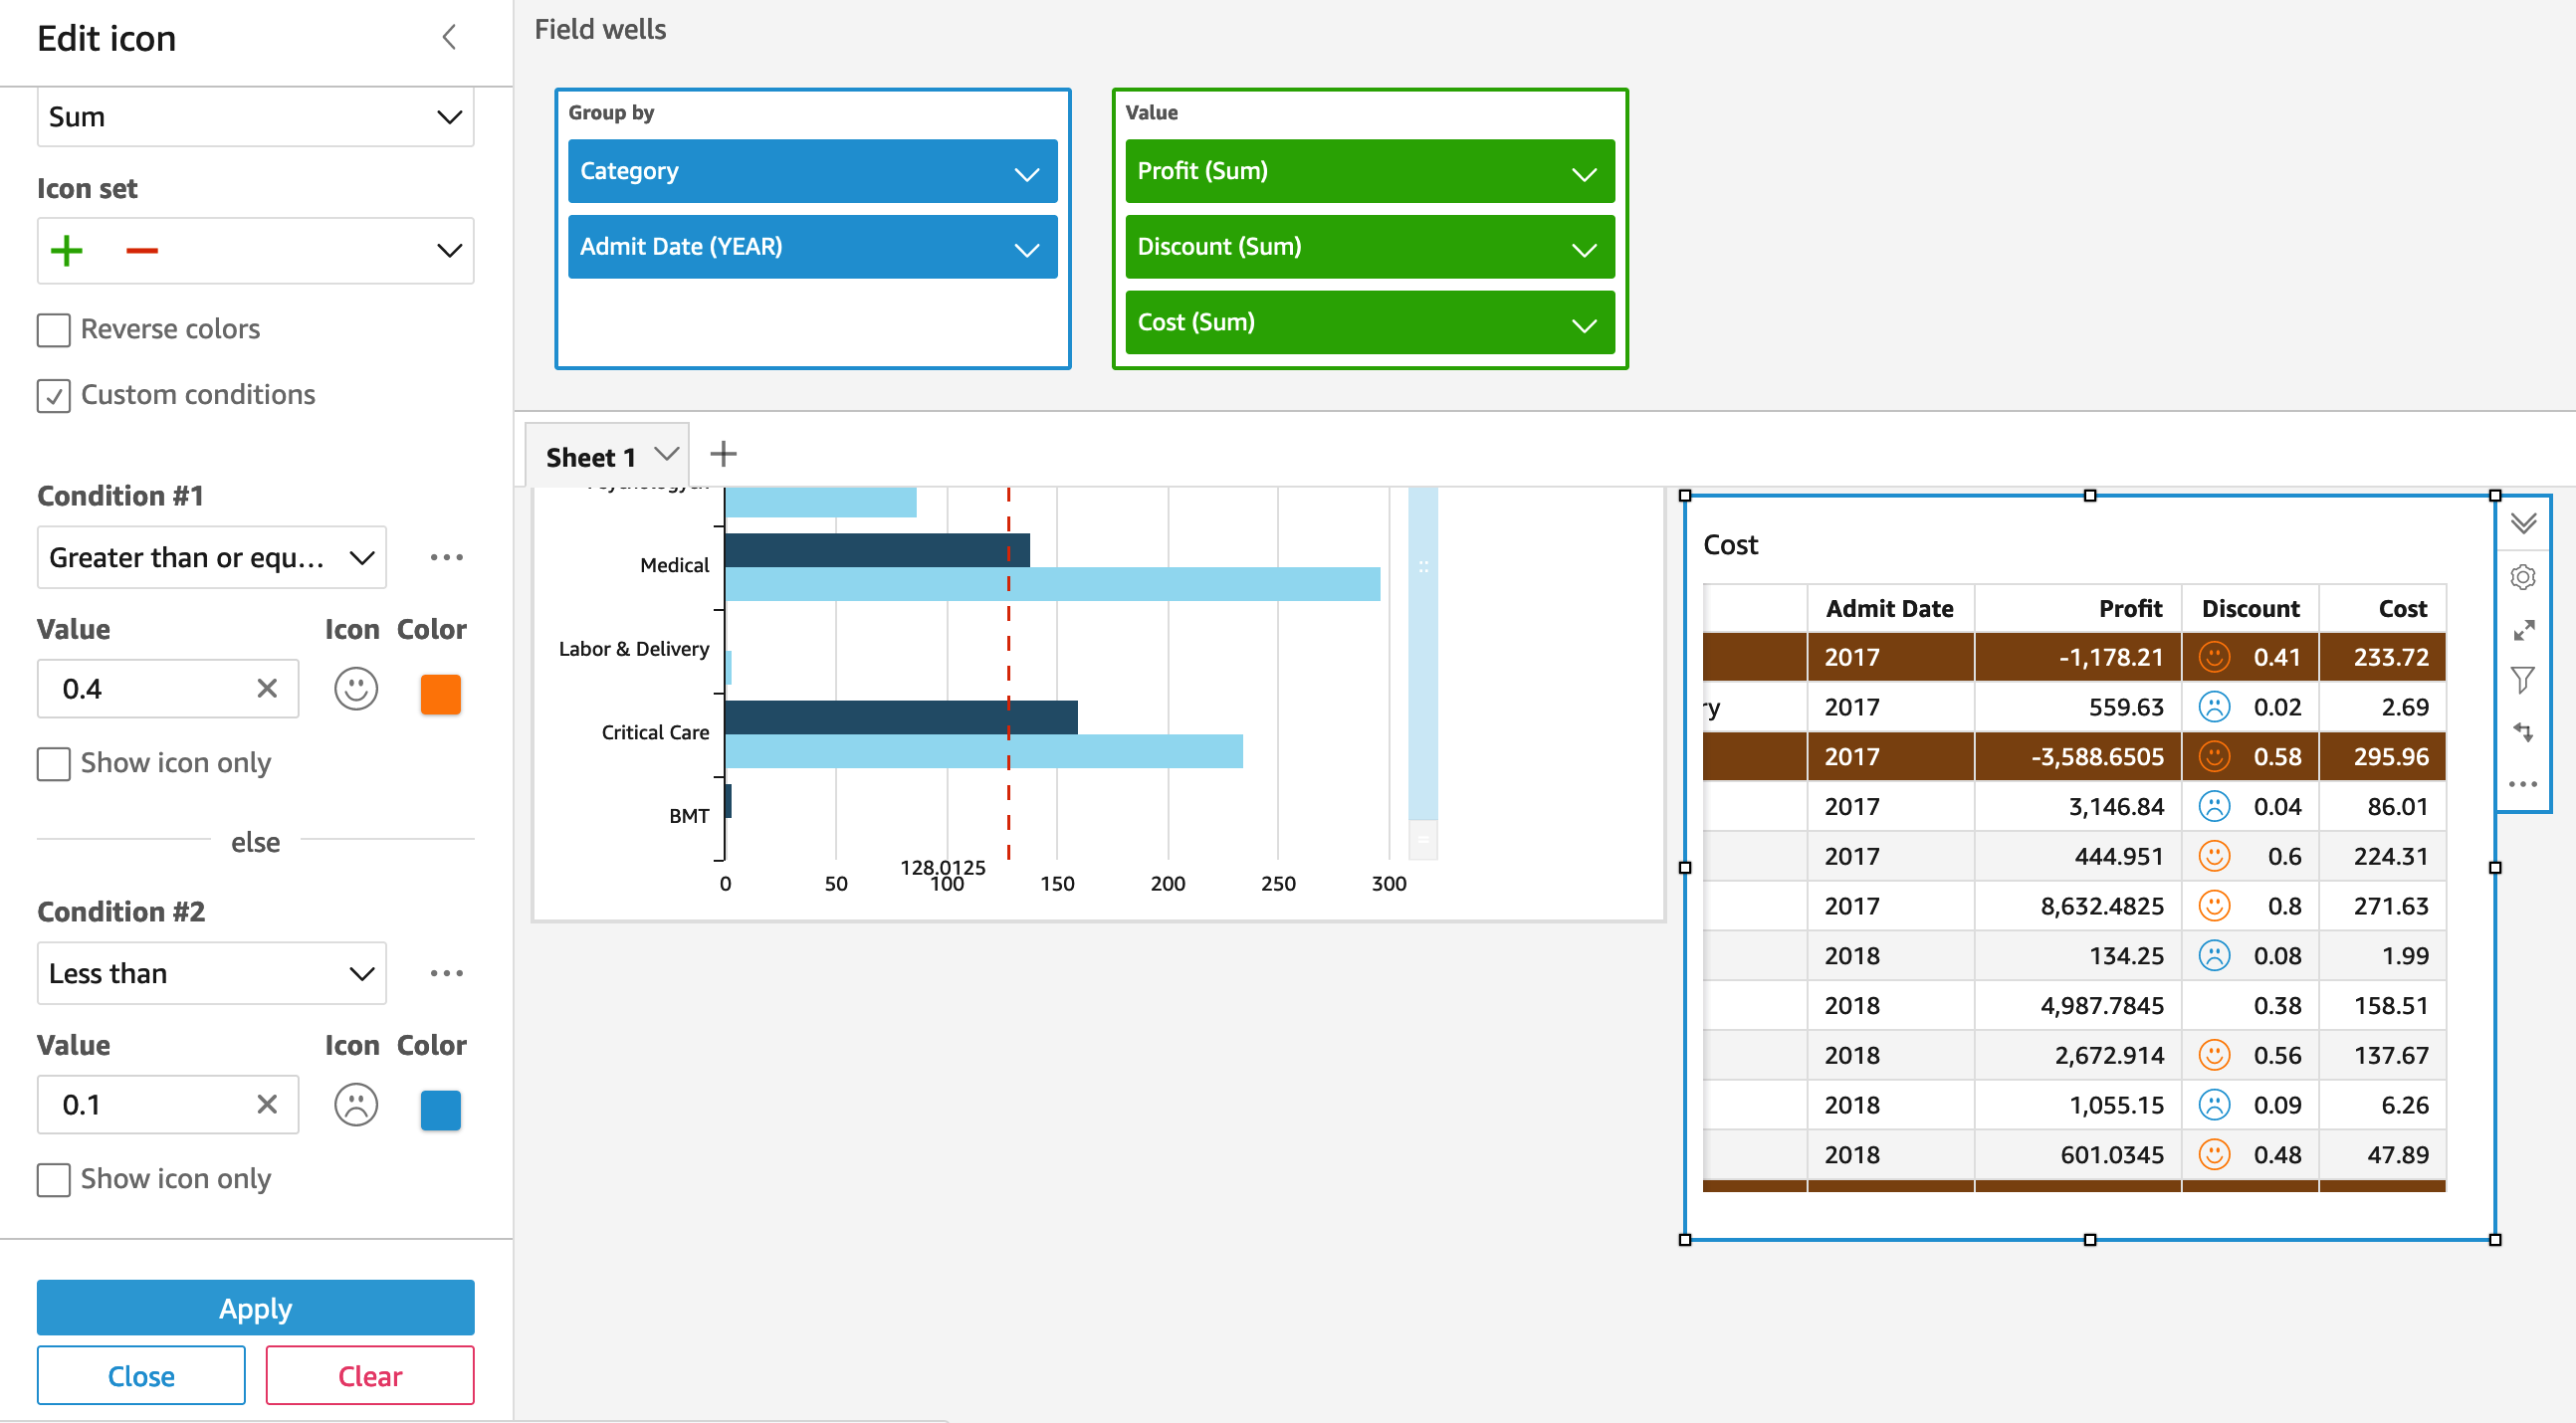
Table
Creating a pivot table in QuickSight is as simple as in Excel. Adding a reference line and
some icons in your table could draw more attention in your presentation.
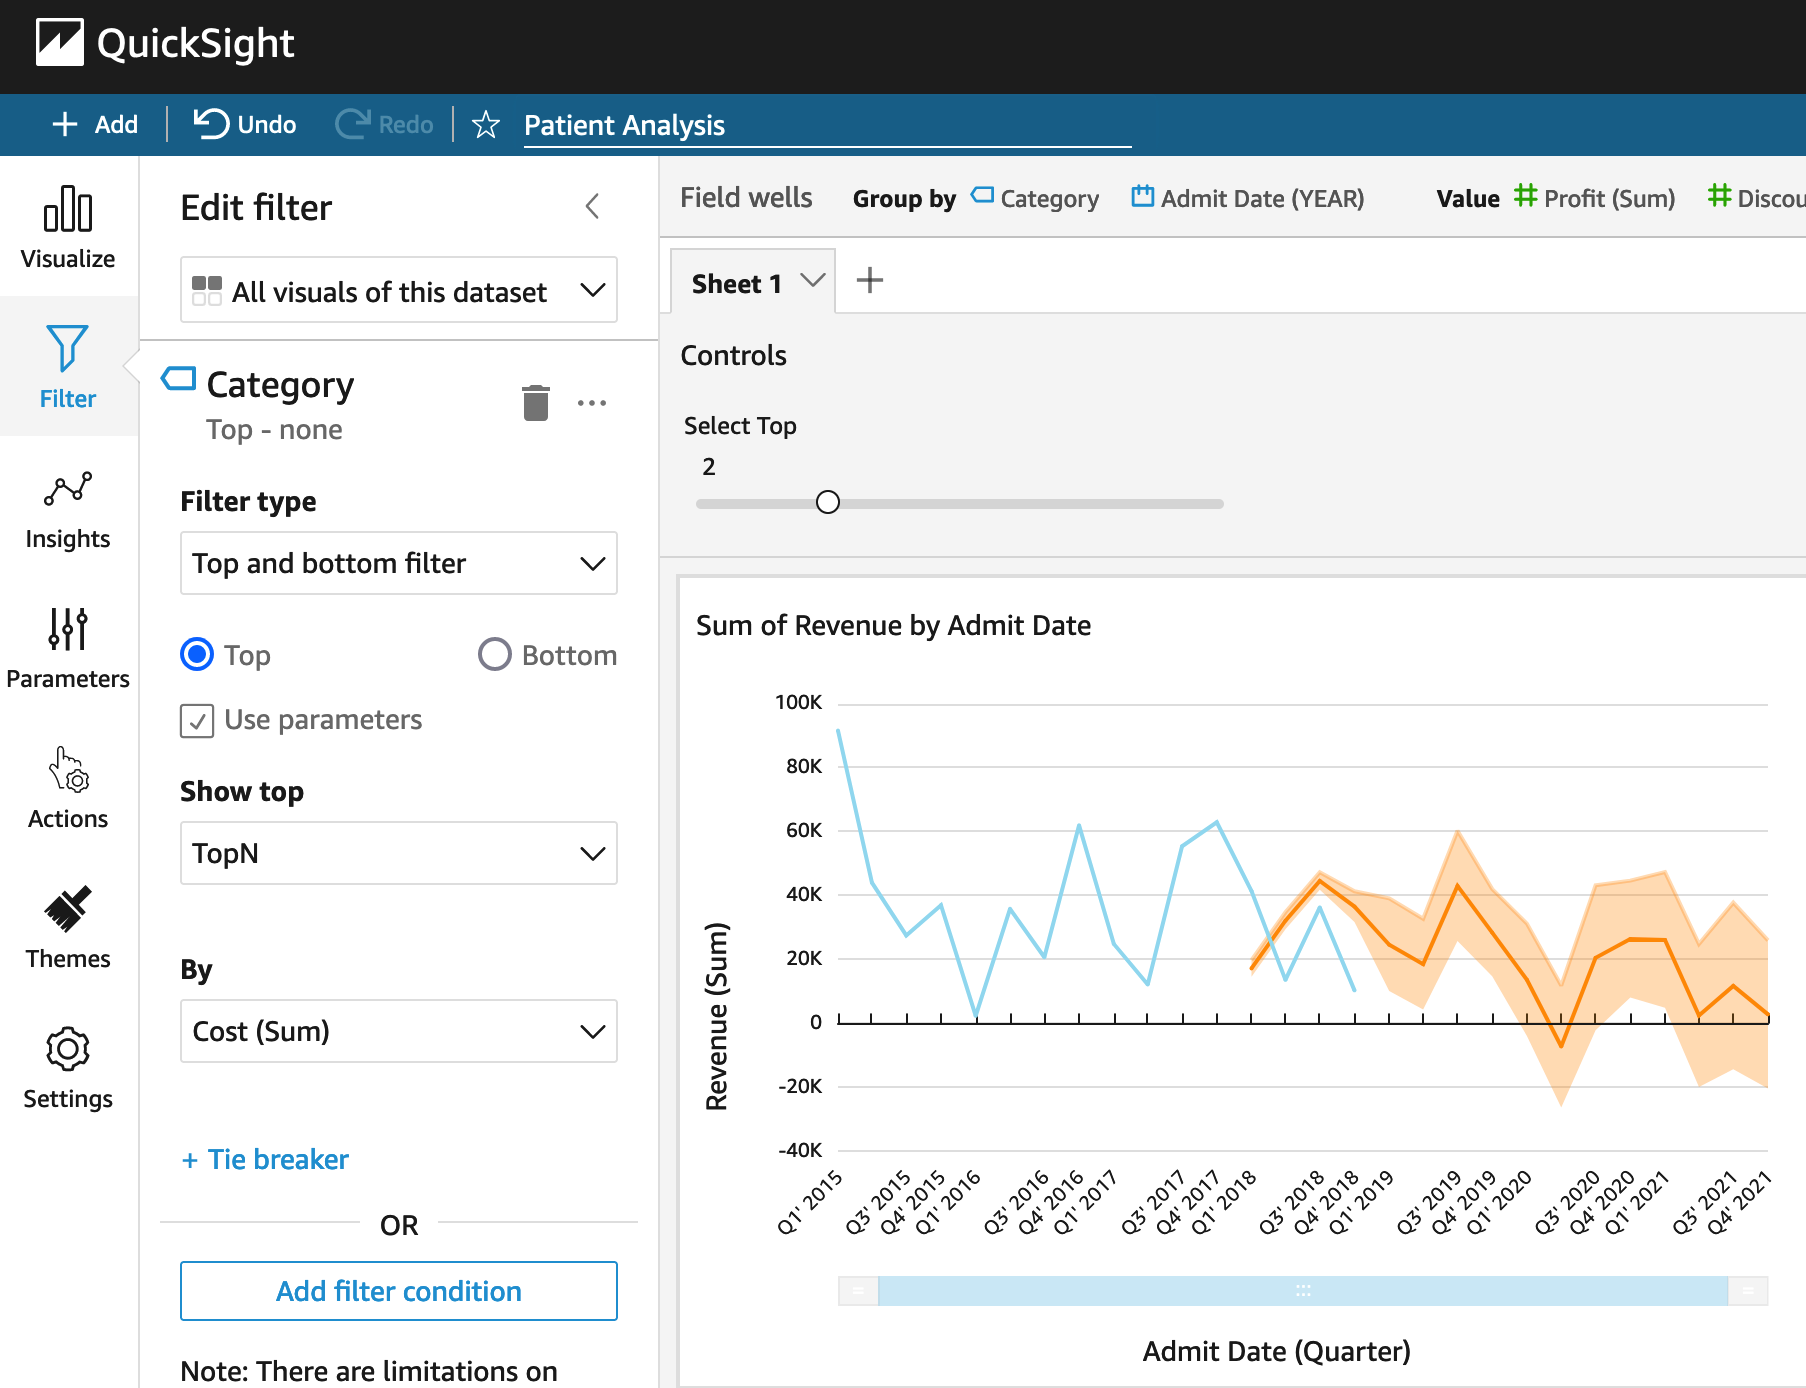
Filters
It's very important to create some filters if you want to
have an interactive dashboard. QuickSight provides this feature for you.
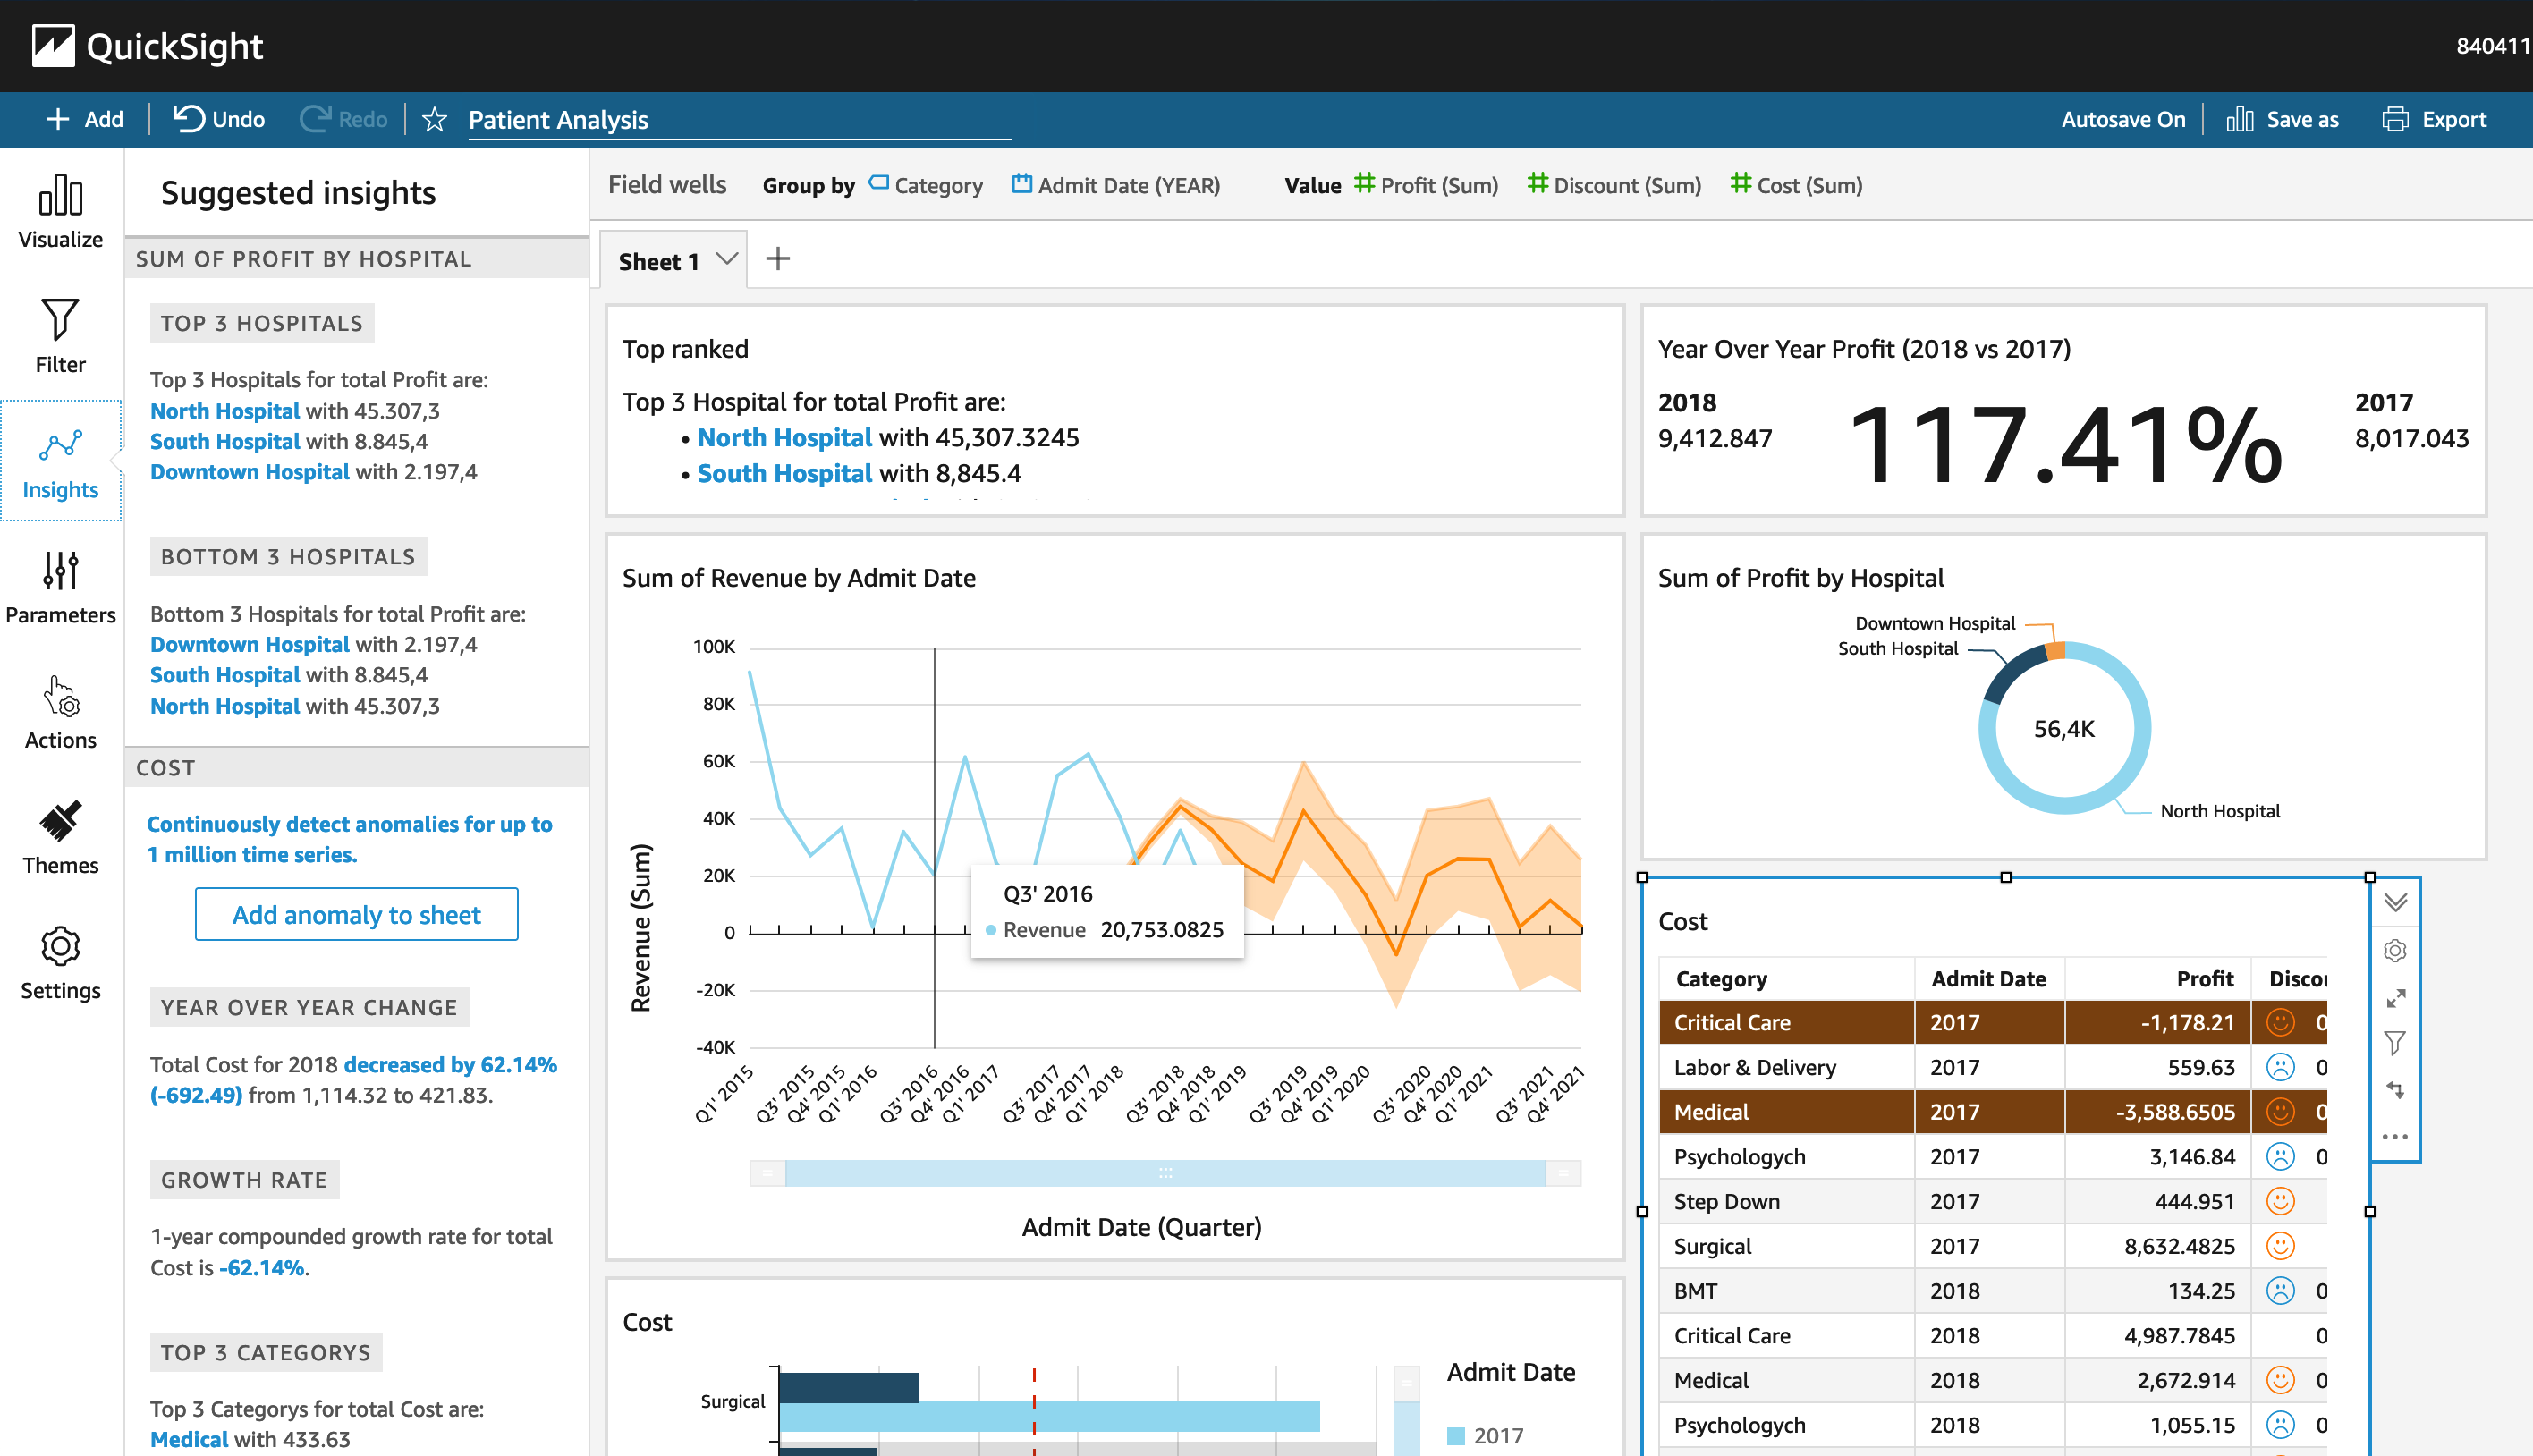
Insights
This is the most impressive function that I've ever seen in a BI tool.
Just by clicking insights, you are able to see all the insights generated by AWS.
You could choose to edit these insights and add your own thoughts. Too quick and too insightful.
Software used: AWS QuickSight
Wechat ID:
jasonfangmagic